


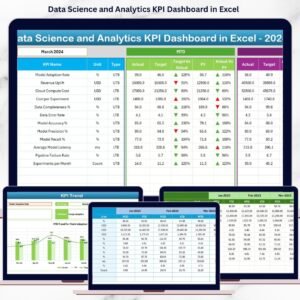
The Incident Management KPI Dashboard in Excel is an essential tool for businesses and teams focused on tracking, managing, and improving incident response processes. Whether you’re in IT support, customer service, or operations, this customizable dashboard helps you monitor key performance indicators (KPIs) related to incident management, track progress, and ensure timely resolution of incidents.
With this easy-to-use Excel dashboard, you can track incident resolution times, categorize incidents by severity, measure SLA compliance, and much more. The visual progress tracking, real-time updates, and interactive features ensure that your team stays on top of every incident, improving response times and overall efficiency.
Key Features of the Incident Management KPI Dashboard in Excel
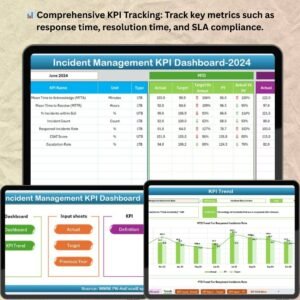
📊 Comprehensive KPI Tracking
Track key incident management KPIs such as response time, resolution time, SLA compliance, and incident severity. Monitor multiple aspects of your incident handling process with ease.
⚡ Real-Time Incident Monitoring
Monitor incident status and track real-time performance using dynamic graphs and visual indicators for each KPI. Stay updated with every incident’s progress.
📅 SLA Compliance Tracking
Ensure that your team is meeting service level agreements (SLAs) with automatic tracking of incident response and resolution times. Easily see if SLAs are being met or missed.
🔄 Customizable for Your Team’s Needs
Adapt the dashboard to your team’s specific needs by adjusting KPIs, SLA targets, and tracking categories. Customize your view to monitor the most relevant data for your team’s performance.
📈 Interactive Dashboard
Visualize your incident management data with an interactive dashboard that summarizes key performance metrics. Identify trends, bottlenecks, and areas for improvement at a glance.
🖥️ User-Friendly Interface
The simple and intuitive design of the dashboard ensures that all team members, regardless of their technical expertise, can easily navigate and update their incident tracking data.
Why You’ll Love the Incident Management KPI Dashboard in Excel

✅ Track Incident Management Performance
Monitor your team’s incident handling efficiency by tracking key KPIs such as resolution times, response times, and SLA compliance.
✅ Stay On Top of Incidents
Real-time monitoring ensures that incidents are tracked as they occur, allowing for quicker responses and improved service levels.
✅ Measure SLA Compliance
Easily track SLA compliance for each incident and ensure that your team is meeting response and resolution time requirements.
✅ Customizable for Your Business
Adjust KPIs, SLA targets, and incident categories to match your business’s specific incident management processes and performance goals.
✅ Improve Incident Response Efficiency
Identify areas of improvement, bottlenecks, and trends in incident resolution times, allowing your team to work more efficiently and deliver better service.
What’s Inside the Incident Management KPI Dashboard in Excel?
- KPI Overview: A summary of essential incident management KPIs, including response time, resolution time, and SLA compliance.
- Real-Time Incident Tracking: Visual progress indicators and real-time data updates to track incident status.
- SLA Compliance Report: Monitor and measure SLA compliance to ensure timely incident resolution.
- Incident Severity Tracking: Categorize and track incidents by severity and monitor their resolution accordingly.
- Interactive Dashboard: A dashboard summarizing the key metrics and offering insights into performance.
How to Use the Incident Management KPI Dashboard in Excel
1️⃣ Download the Template: Instantly access your Excel dashboard after purchase.
2️⃣ Customize the Dashboard: Adjust KPIs, SLA targets, and categories to match your team’s needs.
3️⃣ Track Incident Data: Use the progress indicators and real-time tracking features to monitor incidents as they occur.
4️⃣ Analyze Performance: Regularly review the dashboard to identify trends, performance gaps, and opportunities for improvement.
Who Can Benefit from the Incident Management KPI Dashboard in Excel?
🔹 IT Support Teams
🔹 Customer Service Departments
🔹 Operations Teams
🔹 Incident Response Teams
🔹 Managers & Supervisors Monitoring Incident Handling
🔹 Businesses Focused on Improving Customer Service & Operational Efficiency
Ensure timely incident resolution and improve team performance with this customizable and easy-to-use KPI dashboard.
Click here to read the Detailed blog post
Visit our YouTube channel to learn step-by-step video tutorials
Youtube.com/@PKAnExcelExpert


Reviews
There are no reviews yet.