

Managing a hotel or resort becomes easier when you have the right insights at the right time. The Hospitality & Resorts KPI Dashboard in Power BI is designed to help hospitality leaders, managers, and analysts track and optimize performance with a single glance. Instead of switching between multiple reports, this dashboard brings together occupancy, revenue, service quality, and guest satisfaction into one clean and interactive visual system. 🌟
Hospitality & Resorts KPI Dashboard in Power BI,
This dashboard delivers real-time performance visibility, allowing you to compare actuals with targets, check month-to-date (MTD) and year-to-date (YTD) performance, and instantly detect whether KPIs are improving or declining. Power BI updates everything automatically, giving teams the clarity they need to make faster, smarter decisions.Hospitality & Resorts KPI Dashboard in Power BI
With beautifully structured pages, interactive slicers, and Excel-based data entry, this tool transforms complex hotel operations into a simple, visual, and easy-to-understand performance snapshot. 🏨📊
📦 What’s Inside the Hospitality & Resorts KPI Dashboard in Power BI.
This product includes a professionally designed Power BI dashboard supported by a structured Excel data source. It contains three powerful pages:
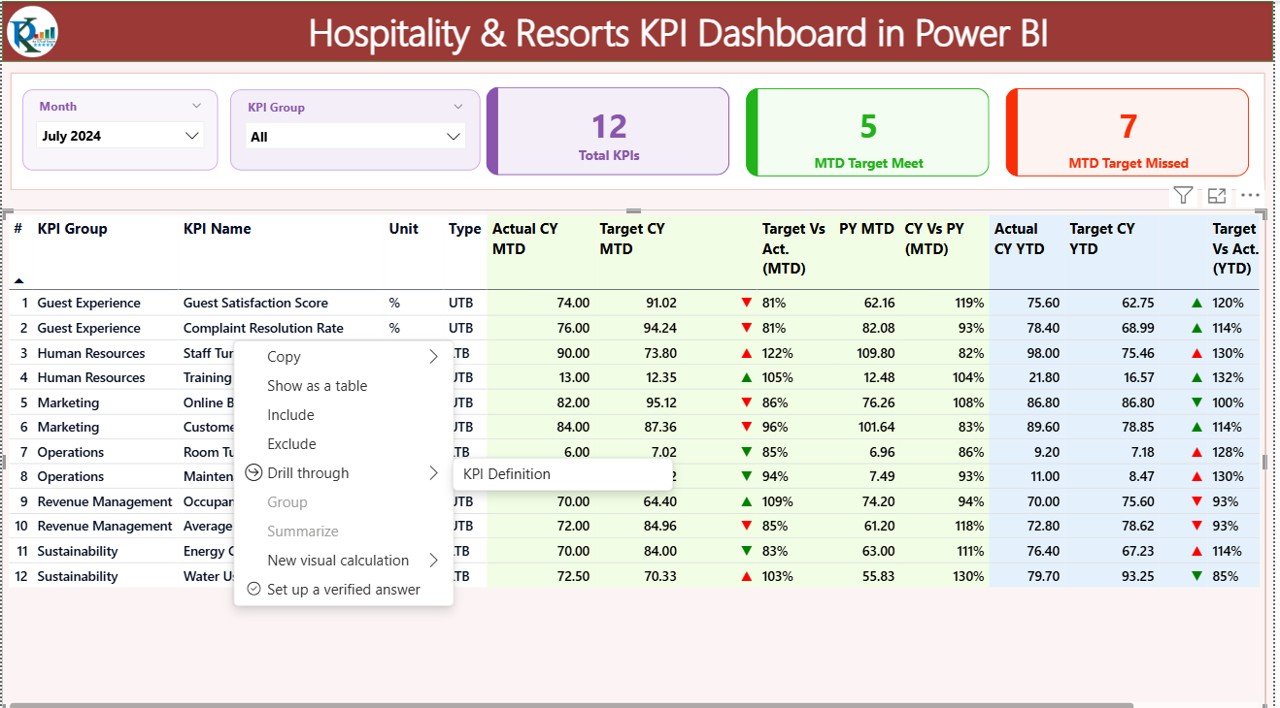
⭐ 1. Summary Page – Your Main Command Center
View total KPIs, target achievements, and misses in a single glance. Interactive slicers make filtering effortless, helping you analyze monthly and category-wise results instantly.Hospitality & Resorts KPI Dashboard in Power BI
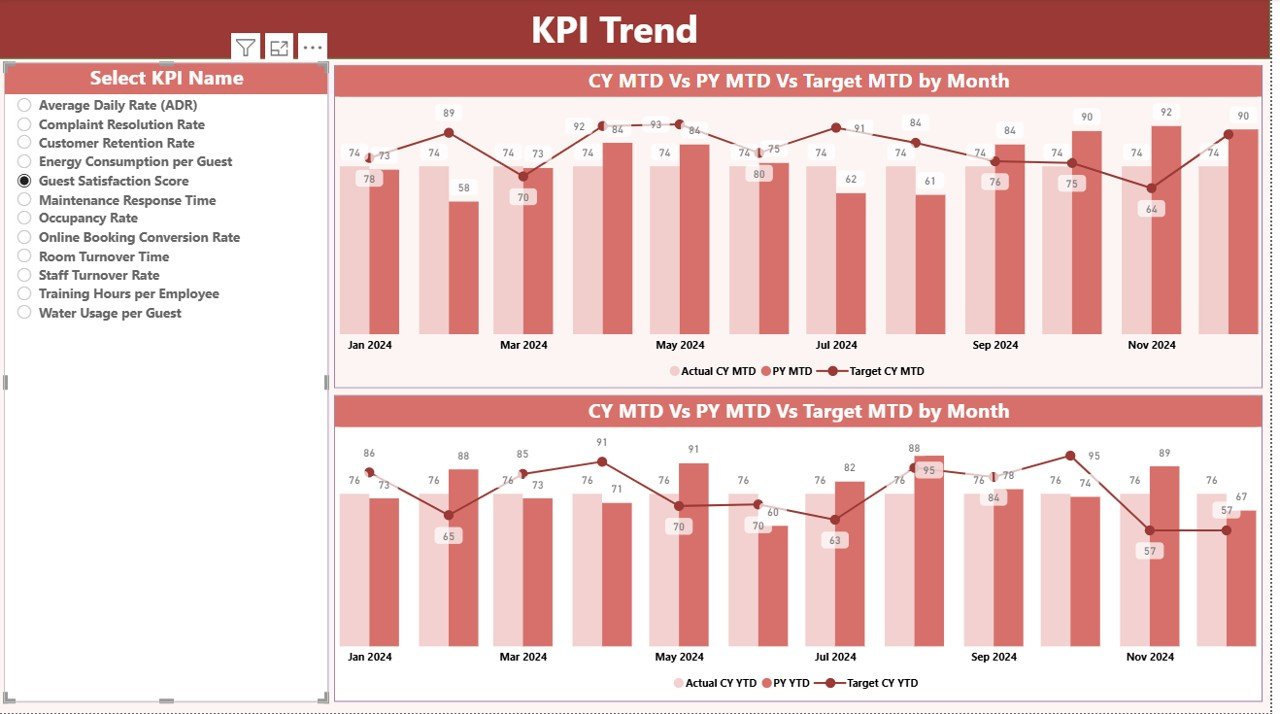
⭐ 2. KPI Trend Page – Visual Performance Insights
Two combo charts show MTD and YTD trends, helping you identify patterns and seasonality—critical for forecasting and revenue planning.
⭐ 3. KPI Definition Page – Deep Dive Into Every Metric
This hidden drill-through page gives clarity about formulas, KPI types (LTB/UTB), and definitions, ensuring consistency across departments.
The Excel data file includes sheets for Input Actuals, Input Targets, and KPI Definitions, making updates extremely easy. Power BI reads the latest numbers and refreshes all visuals in one click.Hospitality & Resorts KPI Dashboard in Power BI

🛠️ How to Use the Hospitality & Resorts KPI Dashboard
Using this dashboard requires zero technical expertise. Here’s how easily you can start:
🔹 Step 1: Update the Excel File
Fill your actual MTD/YTD values and targets in the respective sheets. Use the first date of each month for consistency.
🔹 Step 2: Refresh Power BI
Open the PBIX file and click Refresh. Power BI instantly updates charts, icons, and tables.Hospitality & Resorts KPI Dashboard in Power BI
🔹 Step 3: Analyze KPIs Effortlessly
Use slicers to filter by Month or KPI Group. Track actual vs target, see PY comparisons, and understand performance gaps quickly.
🔹 Step 4: Explore Trend Patterns
Open the KPI Trend page to discover multi-month patterns that impact decision-making.
🔹 Step 5: Drill Into Definitions When Needed
Click on any KPI to see its formula, definition, and type—ensuring clarity across all teams.
This workflow empowers managers, F&B teams, finance departments, operations staff, and leadership with a single reliable source of truth.
🎯 Who Can Benefit from This Dashboard
This dashboard is perfect for:
👨💼 Hotel General Managers
Monitor all KPIs in real time and ensure smooth operations.
📊 Business Analysts & MIS Teams
Generate performance insights without manual reporting.
🧹 Housekeeping & Operations Teams
Track service quality KPIs and take faster corrective action.
🛎️ Front Office & Guest Relations Managers
Improve guest experience using satisfaction and service metrics.
🥘 Food & Beverage Managers
Monitor F&B revenue, efficiency, and service performance instantly.
💼 Resort Owners & Executives
Access a high-level view of business health for strategic planning.
No matter the size of the hotel or resort, this dashboard ensures clarity, speed, accuracy, and smarter decision-making.
### Click here to read the Detailed Blog Post
Watch the step-by-step video tutorial:


Reviews
There are no reviews yet.