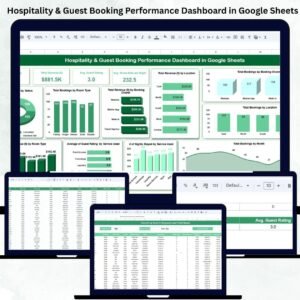
Managing guest bookings and revenue while maintaining exceptional guest satisfaction is key to success in the hospitality industry. The Hospitality & Guest Booking Performance Dashboard in Google Sheets provides a ready-to-use, cloud-based analytics tool that simplifies tracking performance metrics across bookings, revenue, room types, and customer experiences. 🏨📊
Built entirely in Google Sheets, this dashboard offers real-time insights into guest activity and business performance — empowering hotel managers, resort owners, and hospitality professionals to make informed, data-driven decisions without needing complex software.
🔑 Key Features of the Hospitality & Guest Booking Performance Dashboard in Google Sheets
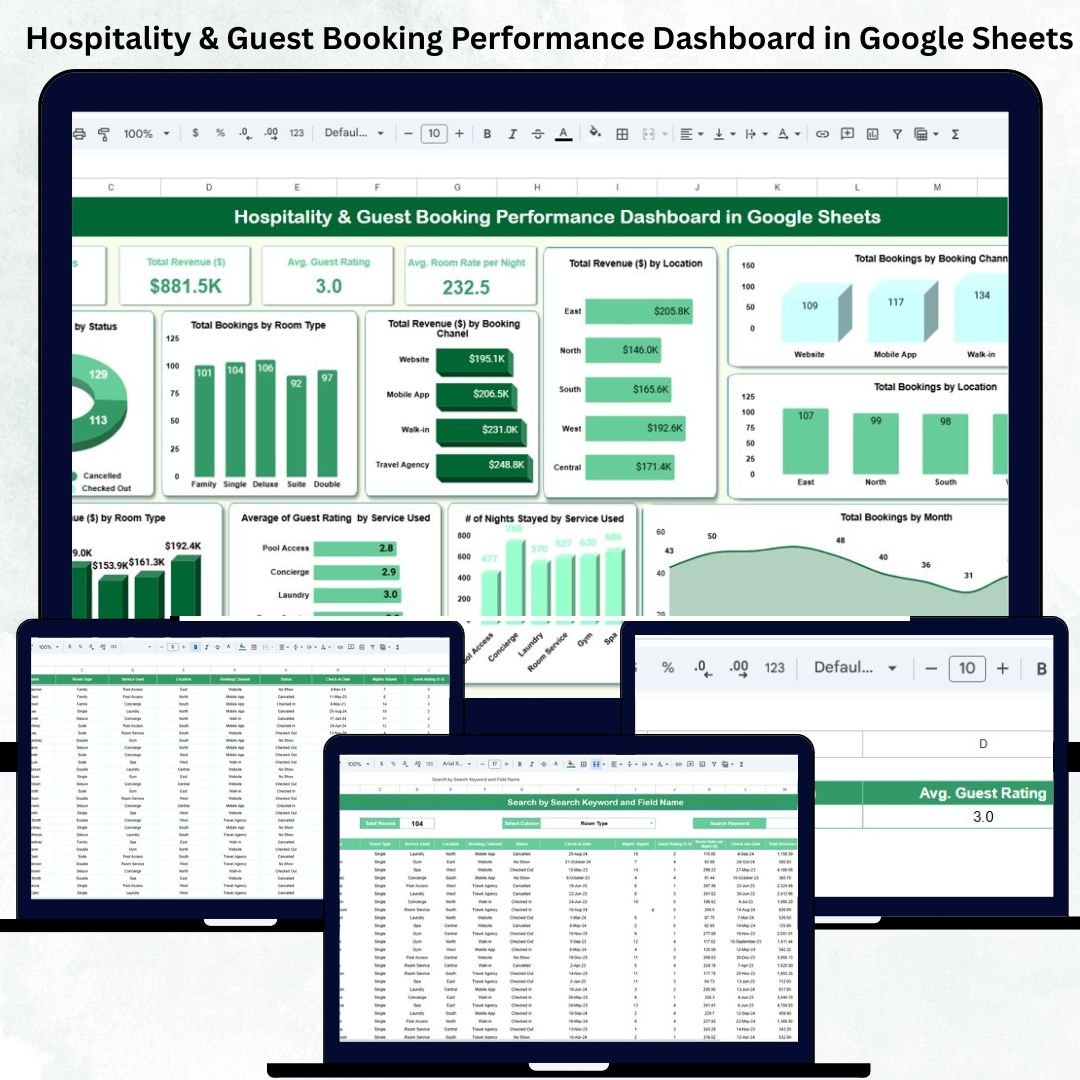
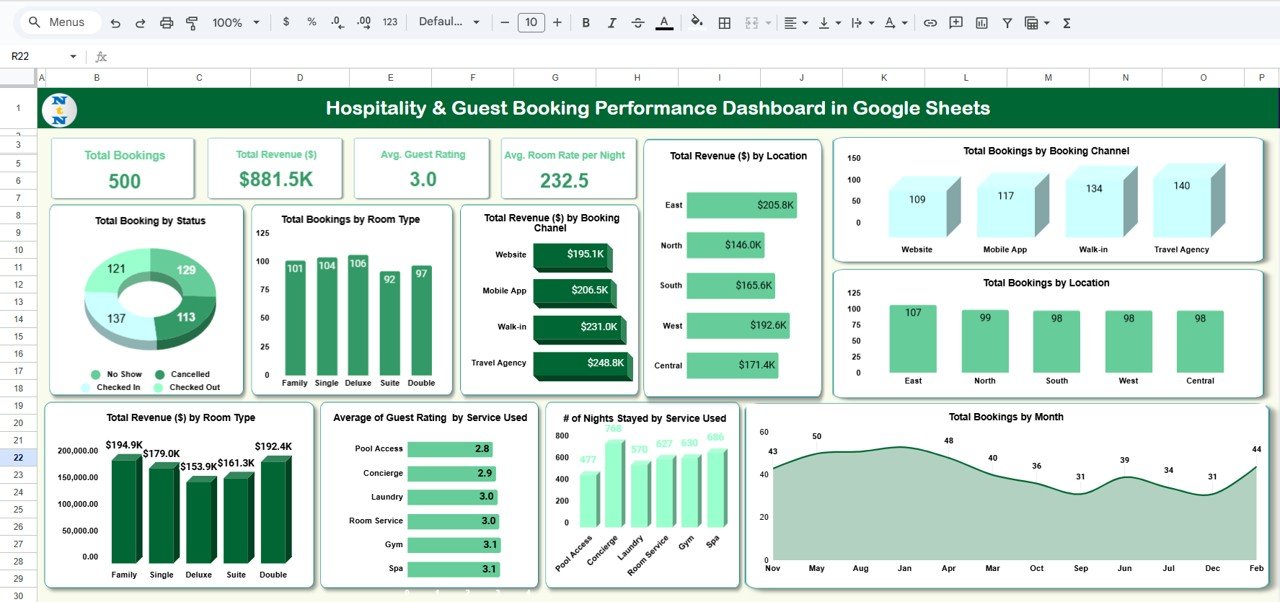
📋 Dashboard Sheet Tab (Main Dashboard)
This is the visual hub of the system, combining interactive KPI cards and charts for a complete overview of your hospitality operations.
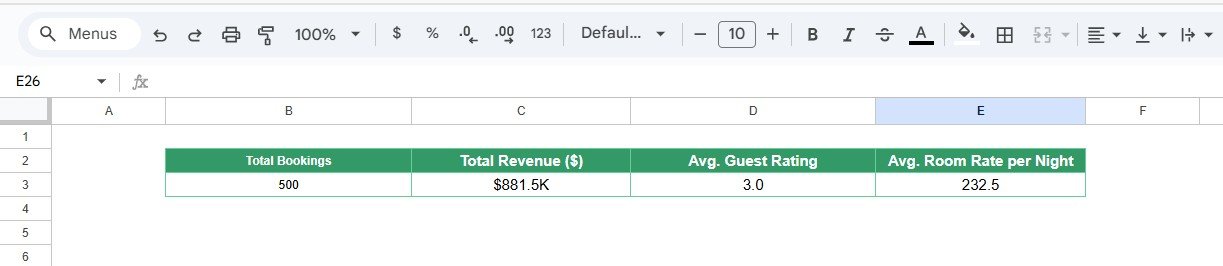
Cards Displayed:
-
🧾 Total Bookings: The total number of guest bookings during the selected period.
-
💰 Total Revenue ($): Total income generated from all confirmed bookings.
-
🌟 Avg. Guest Rating: Reflects overall customer satisfaction levels.
-
🏡 Avg. Room Rate per Night ($): Calculates the average nightly room rate across all bookings.
Charts Included:
-
📊 Total Bookings by Status – Displays Confirmed, Checked-In, Canceled, and Pending bookings.
-
🛏️ Total Bookings by Room Type – Analyzes demand for Deluxe, Family, Suite, or Standard rooms.
-
💵 Total Revenue ($) by Booking Channel – Compares income from Website, Mobile App, Travel Agencies, and Direct bookings.
-
📍 Total Revenue ($) by Location – Highlights top-performing properties or branches.
-
🌐 Total Bookings by Booking Channel – Reveals which platforms bring the most guests.
-
🗺️ Total Bookings by Location – Tracks performance by region or branch.
-
📆 Total Bookings by Month – Identifies seasonal patterns and peak periods.
-
🧘 # of Nights Stayed by Service Used – Measures engagement across services like Spa, Gym, or Room Service.
-
⭐ Average Guest Rating by Service Used – Evaluates guest satisfaction by service category.
-
💼 Total Revenue ($) by Room Type – Breaks down profitability per room category.
All visuals update automatically when new booking data is entered, providing a real-time overview of occupancy and revenue trends.
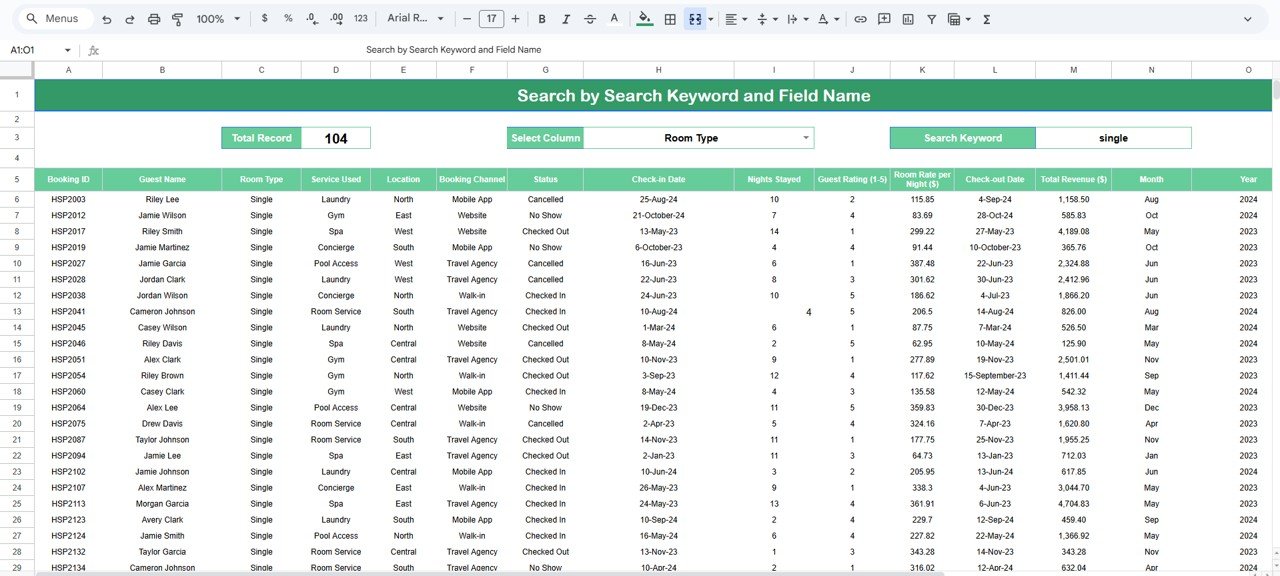
🔍 Search Sheet Tab (Quick Lookup)
Easily locate and filter specific booking details with keyword search functionality.
Examples:
-
“Status = Checked In” → Displays active guest bookings.
-
“Location = East” → Shows bookings from the East property.
-
“Room Type = Suite” → Lists all suite reservations.
-
“Service Used = Spa” → Identifies guests who used spa facilities.
This smart search tool helps front-office and operations teams save time and improve response accuracy.
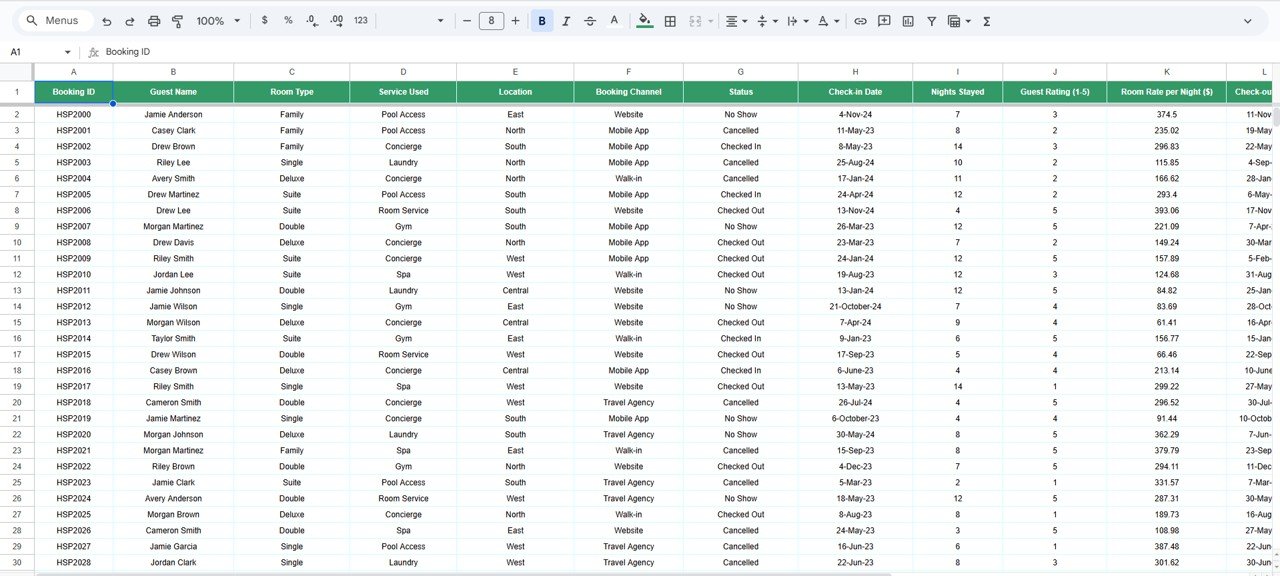
🧾 Data Sheet Tab (Master Data Source)
All booking and revenue data is entered here — forming the foundation for the dashboard’s automated visuals and analytics.
Columns typically include:
-
Booking ID
-
Guest Name
-
Room Type
-
Booking Channel
-
Status
-
Check-in & Check-out Dates
-
Guest Rating
-
Room Rate per Night
-
Services Used
-
Total Revenue ($)
-
Month & Year
📘 Support Sheet Tab (Reference Data)
This tab includes standardized dropdown lists — such as room types, departments, booking channels, and status options — ensuring data consistency and preventing manual input errors.
📦 What’s Inside the Dashboard
✅ Pre-built, automated Google Sheets template
✅ Dynamic KPIs and charts with auto-refresh
✅ Smart search tab for instant record lookups
✅ Cloud collaboration (multi-user access)
✅ Fully editable and customizable structure
✅ Designed for hotels, resorts, homestays, and guesthouses
🧑💼 Who Can Use This Dashboard
🏨 Hotel Managers & Resort Owners – Track bookings, occupancy, and financial performance.
👩💼 Front Office Teams – Manage active check-ins, cancellations, and guest records.
📈 Revenue & Operations Teams – Analyze profitability by room, location, or channel.
🧑🍳 Service Managers – Measure guest engagement across additional services.
It’s the perfect tool for any hospitality business that wants to improve efficiency and data visibility — all within the familiar, accessible environment of Google Sheets.
⚙️ Opportunities for Improvement
Enhance the dashboard further by:
-
📈 Adding Forecasting Tools: Predict bookings or revenue using formulas or scripts.
-
🧾 Integrating Google Forms: Automate guest feedback or booking data entry.
-
🎨 Conditional Formatting: Highlight cancellations or low guest ratings visually.
-
💵 Expense Tracking: Compare revenue versus operating costs.
-
🌍 Demographic Insights: Add guest nationality or travel purpose metrics.
🧠 Best Practices
✅ Update booking statuses daily for accurate reporting.
✅ Review guest ratings weekly to identify satisfaction trends.
✅ Use consistent data formats across sheets.
✅ Protect formula and chart cells from edits.
✅ Analyze monthly trends for marketing and sales planning.
🌟 Why Choose the Hospitality & Guest Booking Performance Dashboard
-
🧭 Comprehensive analytics for bookings, revenue, and service quality
-
💻 100% Google Sheets-based — no installations required
-
📊 Auto-updating KPIs and visualizations
-
☁️ Real-time collaboration across teams
-
🚀 Customizable for hotels, resorts, and homestays
The Hospitality & Guest Booking Performance Dashboard in Google Sheets is the perfect solution for data-driven hospitality management, empowering you to enhance efficiency, guest satisfaction, and profitability. 🏨📈
🔗 Click here to read the Detailed blog post
Watch the step-by-step video Demo:


Reviews
There are no reviews yet.