


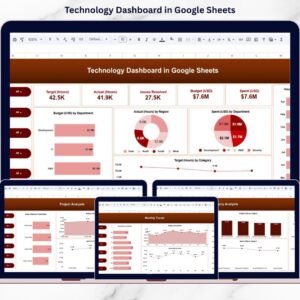
Helpdesk Efficiency KPI Dashboard in Google Sheets is a comprehensive ready-to-use template designed to help IT managers, support team leads, and operations professionals track, analyze, and optimize helpdesk performance metrics with ease. If you have been struggling to consolidate scattered helpdesk data into one unified reporting system, this Google Sheets dashboard template is exactly what you need to bring clarity and actionable insights to your support operations.
Managing a helpdesk without structured KPI tracking often leads to missed targets, slow response times, and frustrated customers. This powerful template transforms your raw helpdesk data into a visually engaging, interactive KPI dashboard that compares Month-to-Date and Year-to-Date actuals against targets and previous year benchmarks. With dynamic conditional formatting arrows, you can instantly spot which KPIs are on track and which ones need immediate attention.
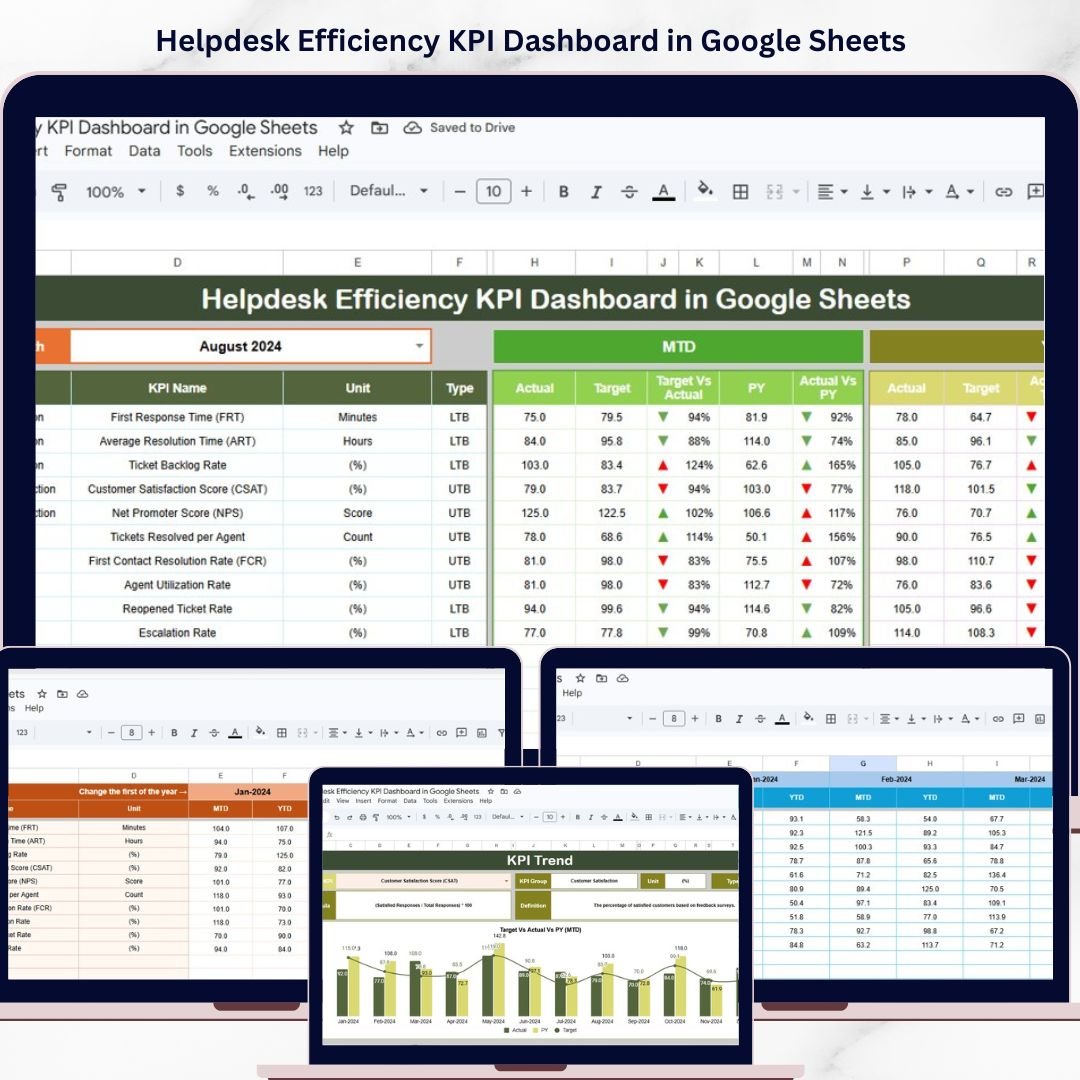
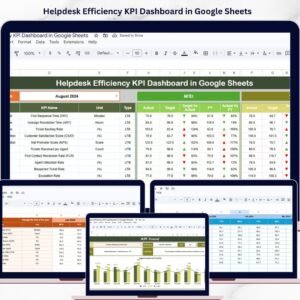
 Helpdesk Efficiency KPI Dashboard in Google Sheets
🔑 Key Features of Helpdesk Efficiency KPI Dashboard in Google Sheets
📊 Interactive KPI Dashboard – Monitor all helpdesk performance metrics including ticket volumes, resolution times, customer satisfaction scores, first contact resolution rates, and SLA compliance in one centralized view with automatic data refresh.
📈 MTD and YTD Comparison – Track Month-to-Date and Year-to-Date actual numbers alongside targets and previous year figures, with conditional formatting up and down arrows showing performance direction at a glance.
🔍 Individual KPI Trend Analysis – Select any KPI from a dropdown to view its detailed trend charts for both MTD and YTD, along with its group, unit, formula, definition, and whether it is Lower the Better or Upper the Better.
📅 Dynamic Month Selection – Change the reporting month from a single dropdown on the dashboard and watch all numbers, charts, and comparisons update instantly.
⚡ Organized Data Input Sheets – Separate sheets for Actual Numbers, Target Numbers, and Previous Year data ensure clean data management and reduce errors during data entry.
📋 KPI Definition Library – A dedicated sheet where you define every KPI with its name, group, unit, formula, full definition, and type for complete organizational transparency.
🔄 Fully Automated Calculations – All formulas, comparisons, and visual indicators are pre-built so you simply enter your numbers and the dashboard does the rest.
📦 What’s Inside the Helpdesk Efficiency KPI Dashboard
This template includes 6 professionally designed worksheets that work together seamlessly:
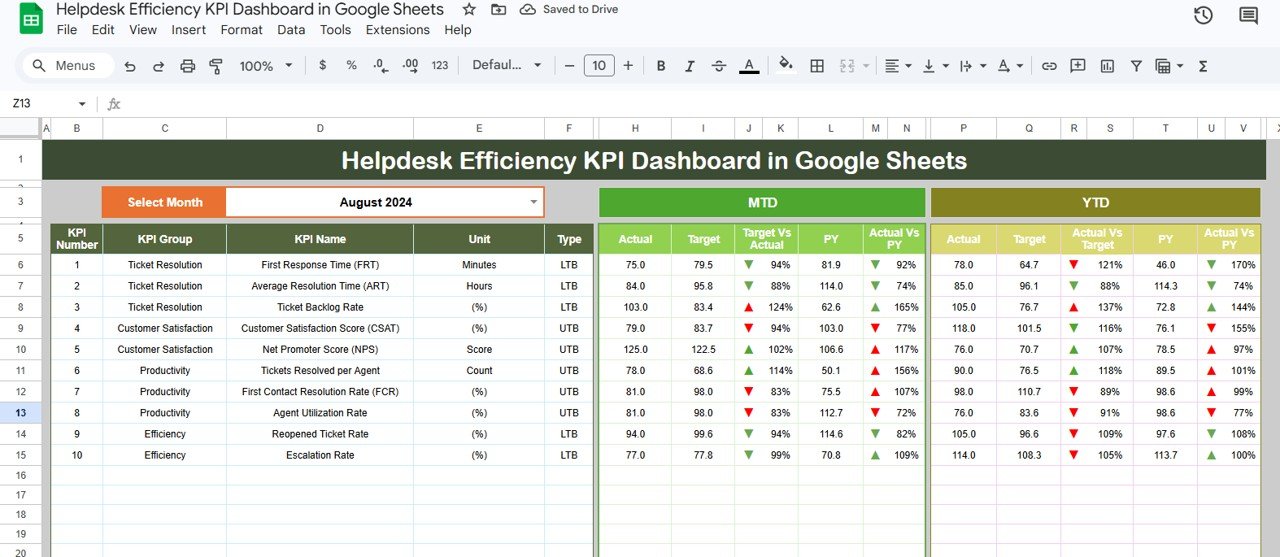
1️⃣ Dashboard Sheet – The main reporting hub displaying all helpdesk KPIs with MTD Actual, Target, Previous Year data and YTD Actual, Target, Previous Year data along with Target vs Actual and PY vs Actual comparisons with conditional formatting arrows. Select any month from the dropdown on range D3 to refresh all numbers.
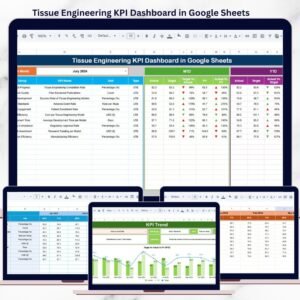
2️⃣ KPI Trend Sheet – Select any KPI from the dropdown on range C3 to view its detailed information including KPI Group, Unit, Type, Formula, and Definition. MTD and YTD trend charts display Actual, Target, and Previous Year performance visually.
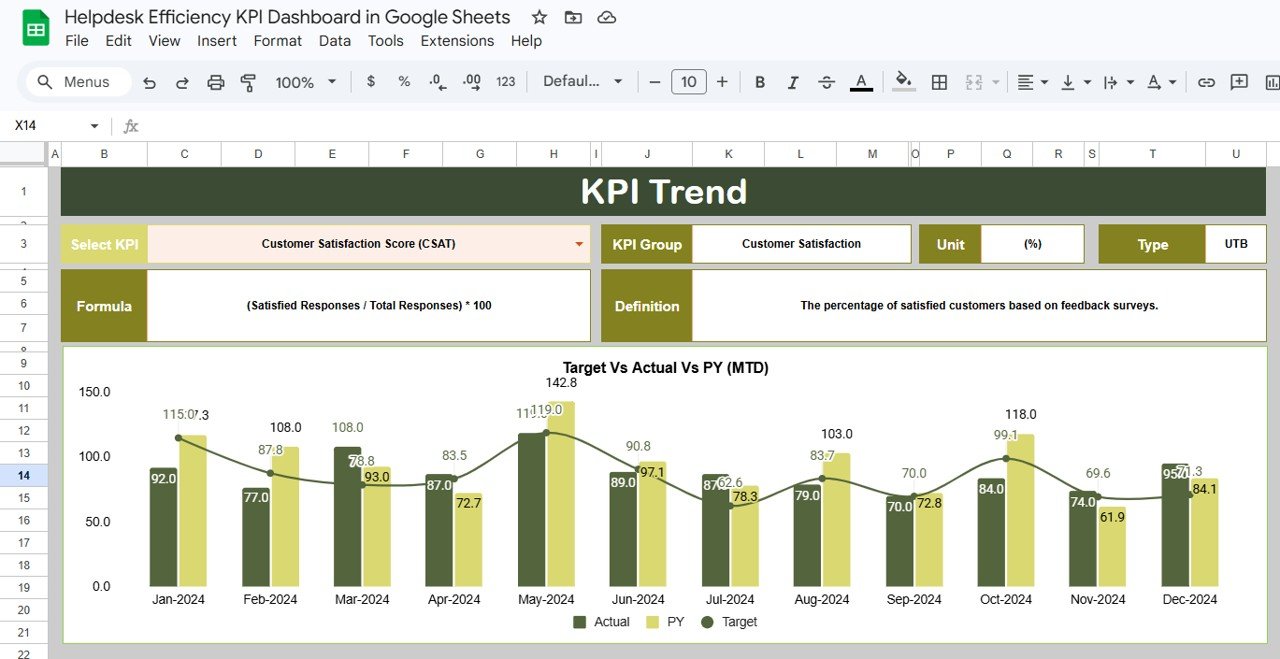 KPI Trend Sheet
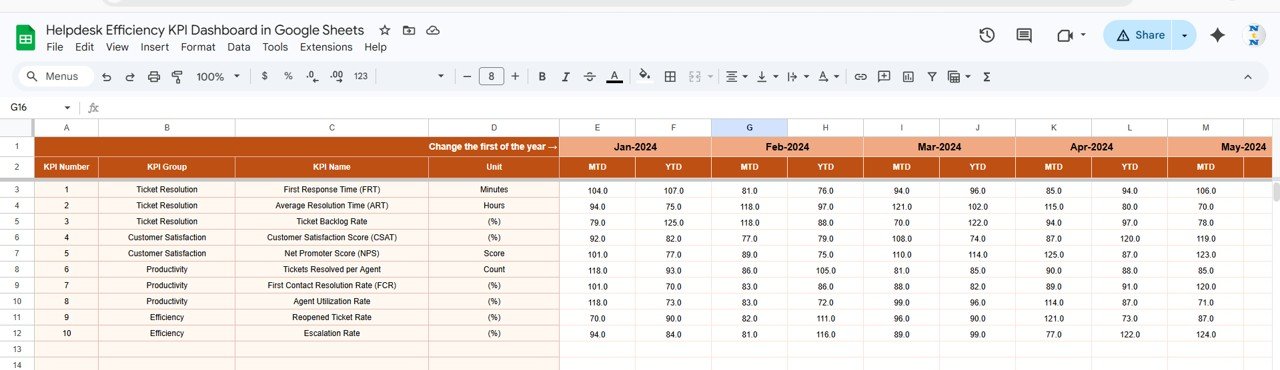
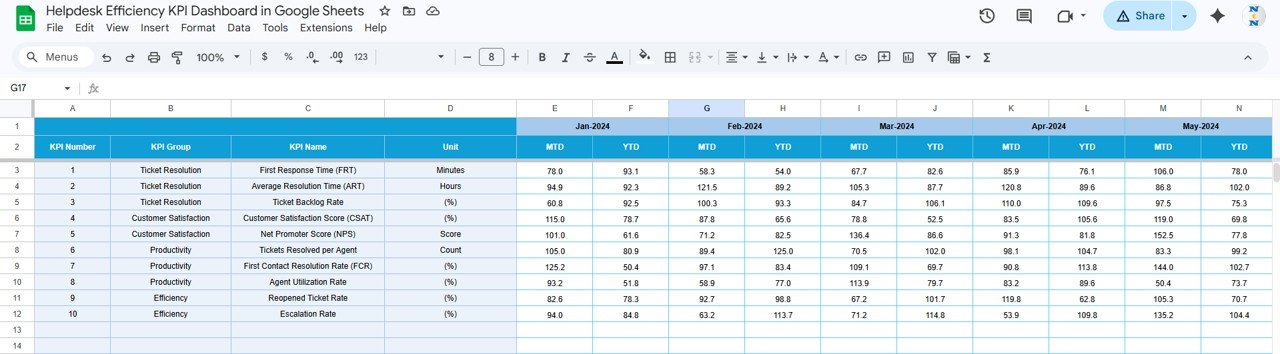
3️⃣ Actual Numbers Input Sheet – Enter your actual helpdesk performance numbers for MTD and YTD for each month. Change the starting month from range E1 to align with your fiscal year.
4️⃣ Target Number Input Sheet – Input the target numbers for each KPI for every month as both MTD and YTD values to establish your performance benchmarks.
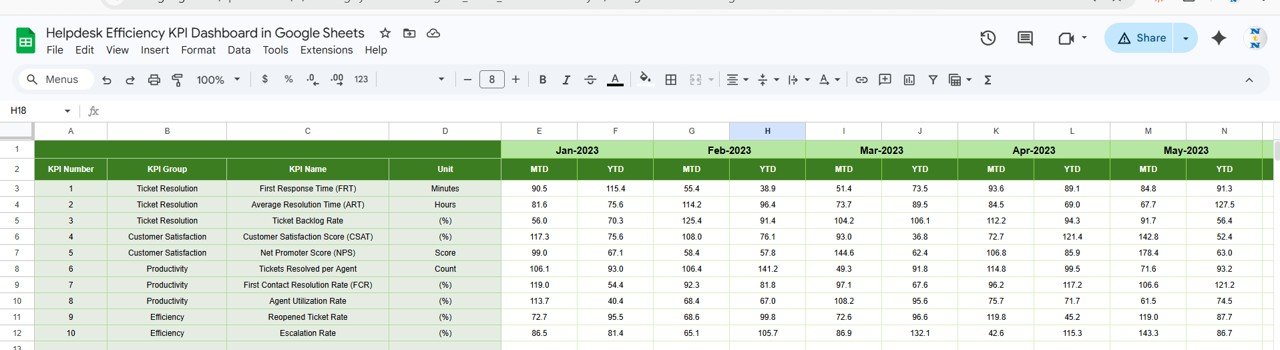
5️⃣ Previous Year Number Sheet – Enter the previous year numbers in the same format as the current year data for accurate year-over-year comparison analysis.
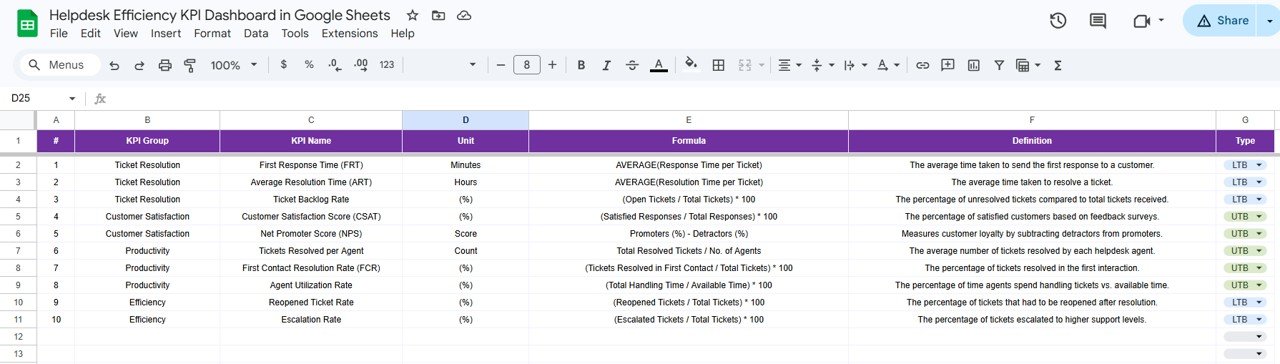
6️⃣ KPI Definition Sheet – Define each KPI with its Name, Group, Unit, Formula, Definition, and Type as LTB (Lower the Better) or UTB (Upper the Better) for standardized reporting across your organization.
 Target Number Input Sheet
⚙️ How to Use the Helpdesk Efficiency KPI Dashboard
1️⃣ Open the KPI Definition sheet and enter all your helpdesk KPIs with their groups, units, formulas, definitions, and types.
2️⃣ Navigate to the Target Number Input sheet and enter your monthly MTD and YTD targets for each KPI.
3️⃣ Fill in the Previous Year Number sheet with last year’s actual performance data for year-over-year comparisons.
4️⃣ Go to the Actual Numbers Input sheet and enter your current helpdesk performance data as it becomes available each month.
5️⃣ Switch to the Dashboard sheet, select your desired month from the dropdown, and instantly view all KPI comparisons with visual performance indicators.
6️⃣ Use the KPI Trend sheet to drill down into individual metrics and analyze performance trends over time.
👥 Who Can Benefit from This Template
🏢 IT Helpdesk Managers – Track team performance, ticket volumes, and resolution metrics to optimize support operations and meet SLA commitments.
📞 Customer Support Leaders – Monitor customer satisfaction scores, first contact resolution rates, and agent productivity to deliver exceptional support experiences.
📊 Operations Directors – Get a bird’s eye view of helpdesk efficiency across departments and make data-driven decisions about staffing and resource allocation.
💼 Small Business Owners – Manage your support team’s performance without investing in expensive helpdesk analytics software using this affordable KPI tracking solution.
🎓 Consultants and Freelancers – Use this professional template to deliver helpdesk performance reports to clients quickly and impressively.
Explore more helpdesk and IT management templates including our IT Helpdesk Ticket Tracker in Google Sheets and Office IT Helpdesk Dashboard in Power BI to build a complete helpdesk reporting ecosystem.


Reviews
There are no reviews yet.