


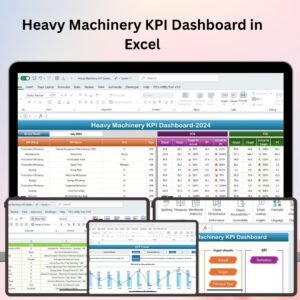
The Heavy Machinery KPI Dashboard in Excel is an essential tool for equipment managers, fleet operators, and construction teams to monitor and optimize the performance of heavy machinery. This Excel-based dashboard helps track critical KPIs such as equipment utilization, maintenance schedules, fuel efficiency, downtime, and operational costs, ensuring that your machinery operates at peak efficiency while minimizing downtime and costs.
With real-time data tracking, automated calculations, and visualizations, this dashboard makes it easier to manage heavy machinery and improve decision-making for better project execution and cost management.

Key Features of the Heavy Machinery KPI Dashboard in Excel:
🚜 Equipment Utilization Monitoring
Track the usage of heavy machinery, including operational hours, idle time, and efficiency. Ensure that all machinery is being used to its full potential and avoid costly underutilization.
🛠️ Maintenance and Repair Tracking
Monitor maintenance schedules, repairs, and service history for each piece of equipment, preventing unexpected breakdowns and extending the lifespan of machinery.
⛽ Fuel Efficiency and Consumption Tracking
Track fuel usage for each machine, helping you optimize fuel efficiency, reduce waste, and minimize operating costs for the equipment fleet.
⚡ Downtime Monitoring
Track the downtime caused by mechanical failure, maintenance, or other factors, helping you identify patterns and take proactive measures to minimize disruptions.
💰 Cost and Budget Tracking
Monitor costs related to equipment operations, including maintenance expenses, fuel, and repairs. This feature helps you stay within budget and optimize costs for each project.
🚀 Why You’ll Love the Heavy Machinery KPI Dashboard in Excel:
✅ Optimize Equipment Utilization – Monitor usage and idle time to ensure that machinery is being fully utilized and not wasting valuable resources.
✅ Improve Maintenance Efficiency – Track maintenance schedules, repair costs, and service history to reduce unexpected downtime and increase machine lifespan.
✅ Control Fuel Costs – Monitor fuel consumption and identify opportunities to optimize fuel efficiency, helping reduce fuel-related expenses.
✅ Reduce Downtime – Track downtime and identify the root causes of disruptions, enabling you to reduce delays and improve project timelines.
✅ Track Operational Costs – Keep track of equipment-related expenses such as fuel, maintenance, and repairs to stay within budget and optimize operational efficiency.
✅ Fully Customizable and Interactive – Fully customizable to suit your specific machinery needs, with interactive charts and real-time tracking for effective decision-making.
What’s Inside the Heavy Machinery KPI Dashboard in Excel:
-
Equipment Utilization: Track operating hours, idle time, and machine efficiency to ensure full utilization of your heavy machinery.
-
Maintenance and Repair Tracking: Monitor scheduled maintenance, repairs, and service intervals to avoid unexpected downtime and keep your machinery running smoothly.
-
Fuel Consumption: Track fuel consumption and optimize fuel usage to reduce operating costs and improve machine efficiency.
-
Downtime Tracking: Track downtime caused by mechanical failure or maintenance to identify recurring issues and minimize project delays.
-
Cost Management: Monitor costs related to fuel, repairs, and maintenance to keep equipment operations within budget.
-
Custom Reports: Generate detailed reports summarizing key performance metrics, helping you make informed decisions and improve machinery management.
How to Use the Heavy Machinery KPI Dashboard in Excel:
1️⃣ Download the Template – Instantly access your Excel file upon purchase.
2️⃣ Input Machinery Data – Enter data for equipment usage, fuel consumption, downtime, maintenance schedules, and operational costs to start tracking KPIs.
3️⃣ Monitor Equipment Performance – Use the dashboard to monitor machinery utilization, maintenance, fuel usage, and downtime in real-time.
4️⃣ Analyze Trends – Track trends in machinery performance, including downtime and fuel consumption, to identify areas for improvement.
5️⃣ Generate Reports – Create customized reports summarizing equipment performance, costs, and maintenance needs to make data-driven decisions.
Who Can Benefit from the Heavy Machinery KPI Dashboard in Excel:
-
Fleet Managers
-
Construction Managers
-
Equipment Maintenance Teams
-
Operations Managers
-
Financial Managers in Construction
-
Heavy Machinery Rental Companies
-
Large Construction Companies
-
Equipment and Machinery Dealers
The Heavy Machinery KPI Dashboard in Excel is the ideal solution for managing and optimizing your machinery fleet. With features that help you track equipment utilization, monitor maintenance, and control operational costs, this dashboard ensures that your machinery remains efficient and cost-effective, helping you stay on top of your projects.
Click here to read the Detailed blog post
https://www.pk-anexcelexpert.com/heavy-machinery-kpi-dashboard-in-excel/
Visit our YouTube channel to learn step-by-step video tutorials
Youtube.com/@PKAnExcelExpert


Reviews
There are no reviews yet.