Healthcare organizations manage multiple tenders every year across departments, vendors, and service categories. These tenders include medical equipment, pharmaceuticals, IT systems, facility services, and outsourced healthcare operations. Because healthcare budgets are sensitive and compliance requirements are strict, even small inefficiencies in tender management can lead to cost overruns, delayed approvals, and missed savings opportunities. Unfortunately, many hospitals still rely on manual spreadsheets and disconnected reports, which makes tracking tenders slow and risky.
That is exactly why the Health Tender Dashboard in Power BI becomes an essential solution.
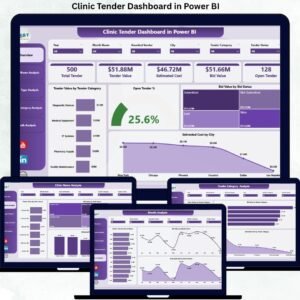
This ready-to-use Power BI dashboard transforms raw healthcare tender data into clear, interactive, and decision-ready insights. Instead of manually reviewing tender lists and reports, healthcare leaders gain instant visibility into estimated value, awarded value, savings, open tenders, vendor performance, manager efficiency, and monthly trends—all from one centralized dashboard.
Built in Power BI, this dashboard delivers enterprise-level analytics with interactive filters, drill-downs, and professional visuals. As a result, procurement teams, finance departments, and hospital leadership can manage tenders with confidence, transparency, and control.
⚙️ Key Features of the Health Tender Dashboard in Power BI
📊 Centralized Tender Visibility
Track all healthcare tenders in one interactive dashboard instead of managing multiple spreadsheets.
💰 Estimated vs Awarded Value Tracking
Quickly compare planned tender value against awarded value to control spending.
📉 Savings Analysis
Identify cost savings achieved through negotiation and vendor competition.
🧑🤝🧑 Vendor & Manager Performance Monitoring
Evaluate suppliers and tender managers using objective, data-driven insights.
📅 Monthly Trend Analysis
Understand how tender performance evolves over time and identify improvement areas.
📦 What’s Inside the Health Tender Dashboard in Power BI
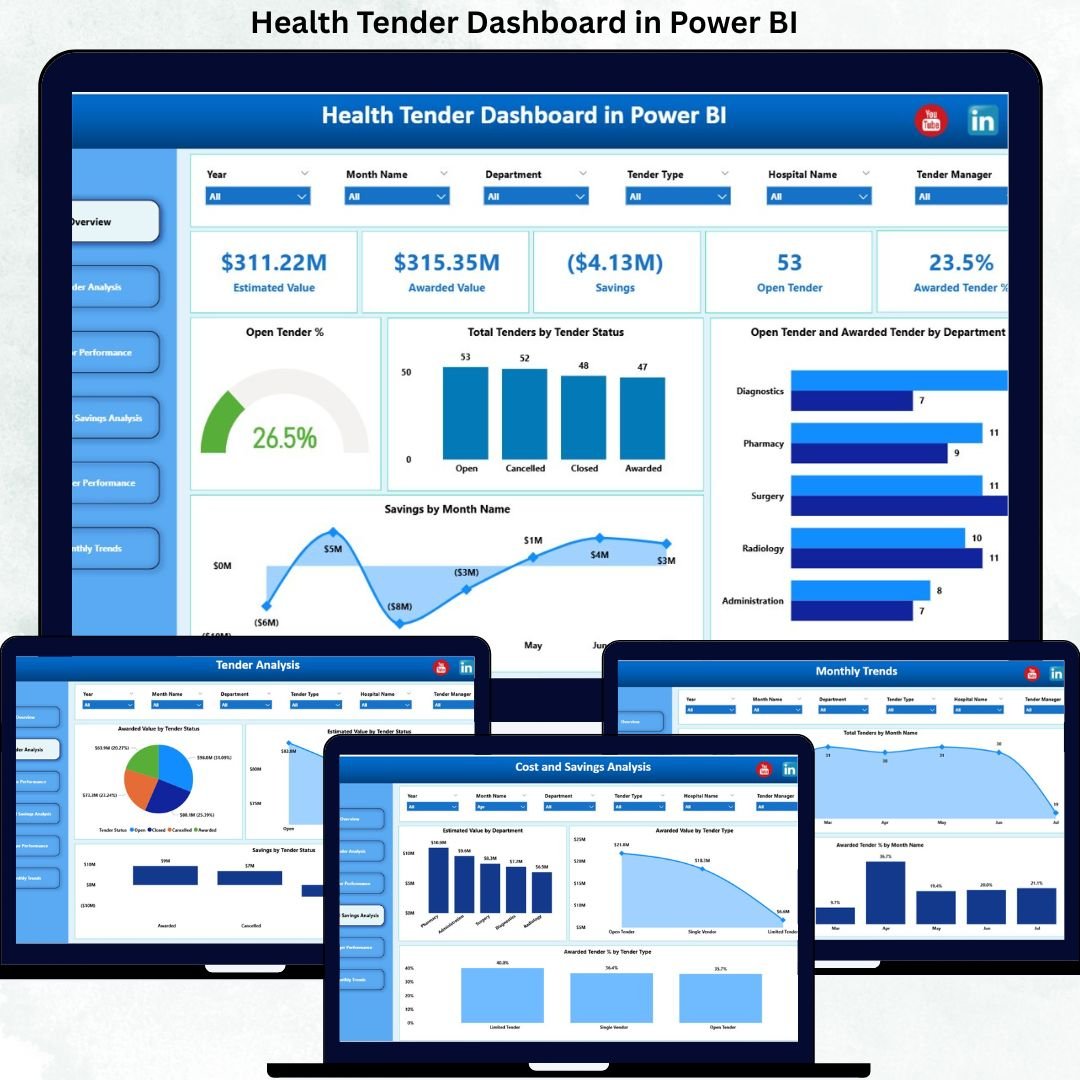
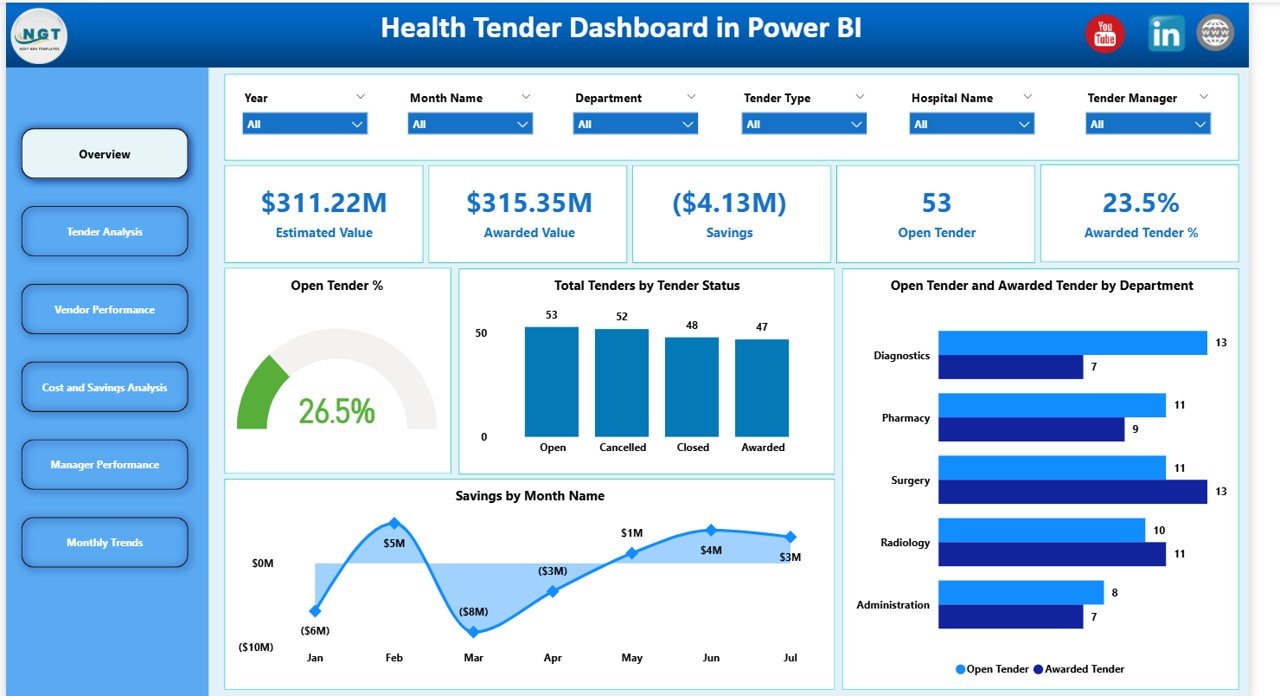
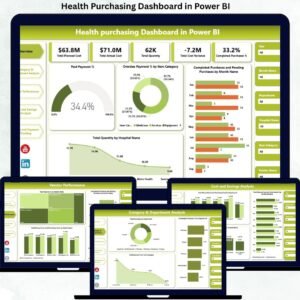
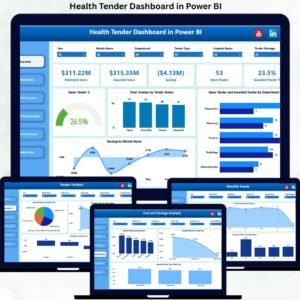
🖥️ Overview Section – Executive Tender Snapshot
The Overview section gives decision-makers an instant understanding of overall tender performance.
KPI Cards Included
-
Estimated Value – Total expected value of all tenders
-
Awarded Value – Total value of awarded tenders
-
Savings – Difference between estimated and awarded values
-
Open Tender – Number of tenders still pending
-
Awarded Tender % – Tender award success rate
Overview Charts
-
Open Tender % – Highlights pending workload
-
Total Tenders by Tender Status – Open, Awarded, Cancelled
-
Open vs Awarded Tenders by Department – Department-wise efficiency
-
Savings by Month – Tracks monthly cost improvements
These visuals allow leadership to assess tender health within seconds.
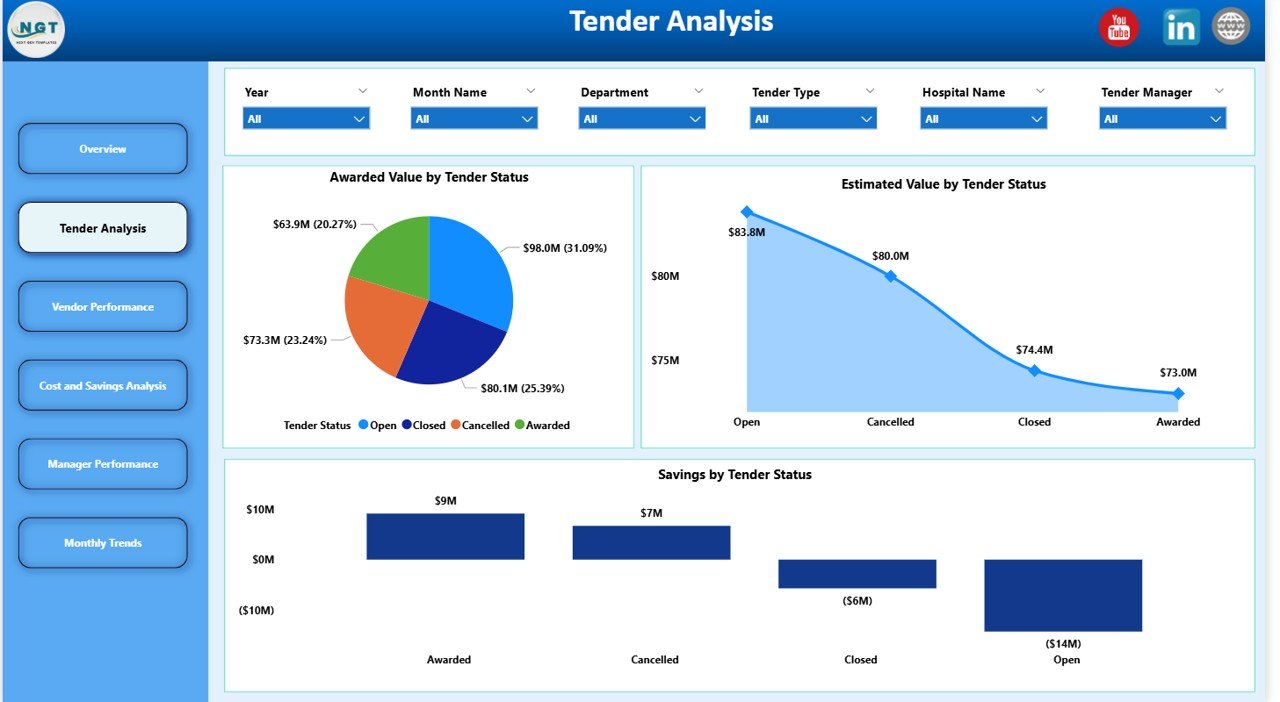
📊 Tender Analysis – Understanding Tender Outcomes
This section focuses on how tenders perform across different stages.
Charts Included
-
Awarded Value by Tender Status
-
Estimated Value by Tender Status
-
Savings by Tender Status
This analysis helps procurement teams understand where financial commitments and savings occur in the tender lifecycle.
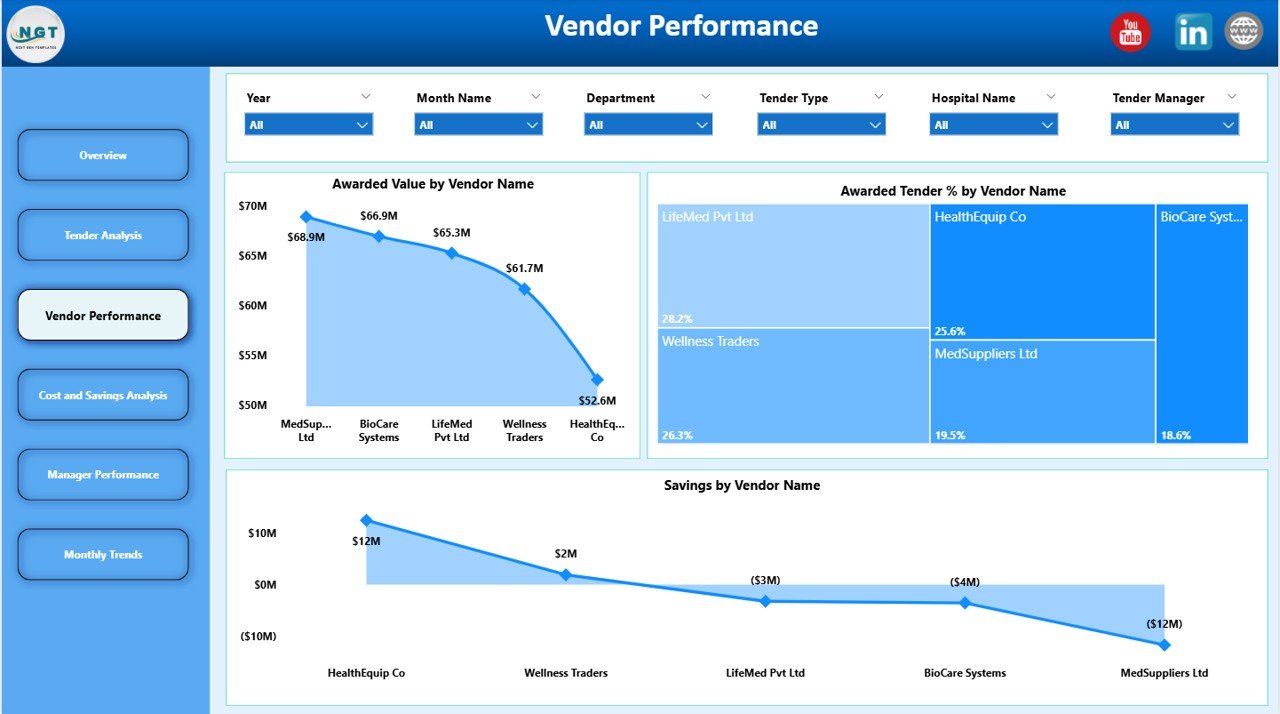
🧑🤝🧑 Vendor Performance Analysis – Supplier Effectiveness
Vendor performance directly impacts healthcare procurement success.
Charts Included
-
Awarded Value by Vendor Name
-
Awarded Tender % by Vendor Name
-
Savings by Vendor Name
These insights help healthcare organizations select reliable vendors, improve negotiations, and reduce supplier risk.
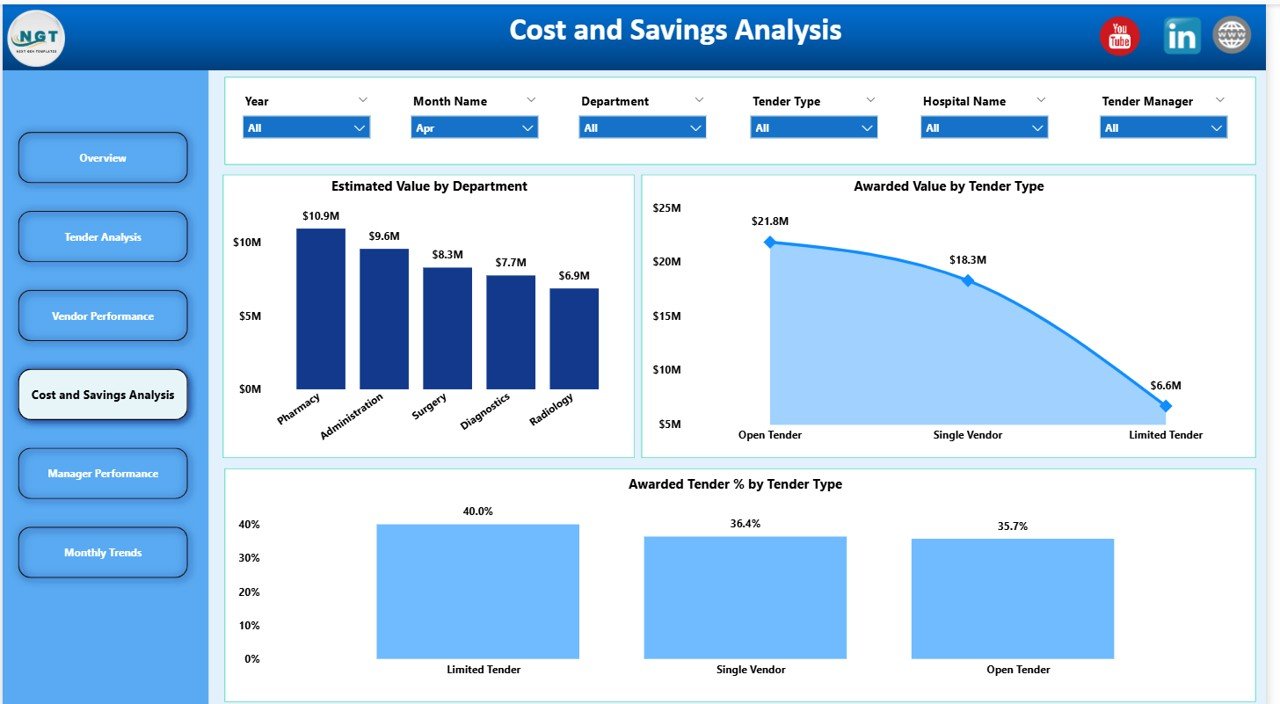
💰 Cost & Savings Analysis – Financial Control
This section provides financial visibility across departments and tender types.
Charts Included
-
Estimated Value by Department
-
Awarded Value by Tender Type
-
Awarded Tender % by Tender Type
Finance teams use this analysis to strengthen budget control and sourcing strategies.
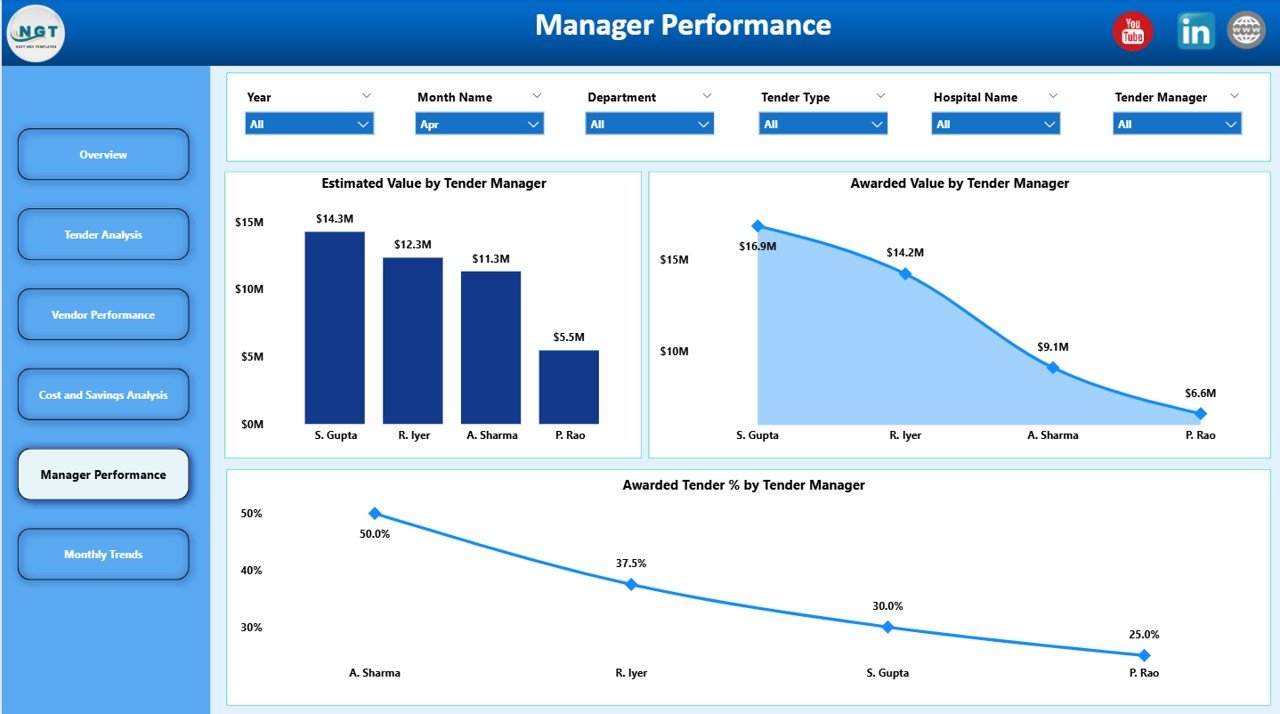
👩💼 Manager Performance – Accountability & Governance
Tender managers play a critical role in procurement efficiency.
Charts Included
-
Estimated Value by Tender Manager
-
Awarded Value by Tender Manager
This view improves accountability and supports performance-based governance.
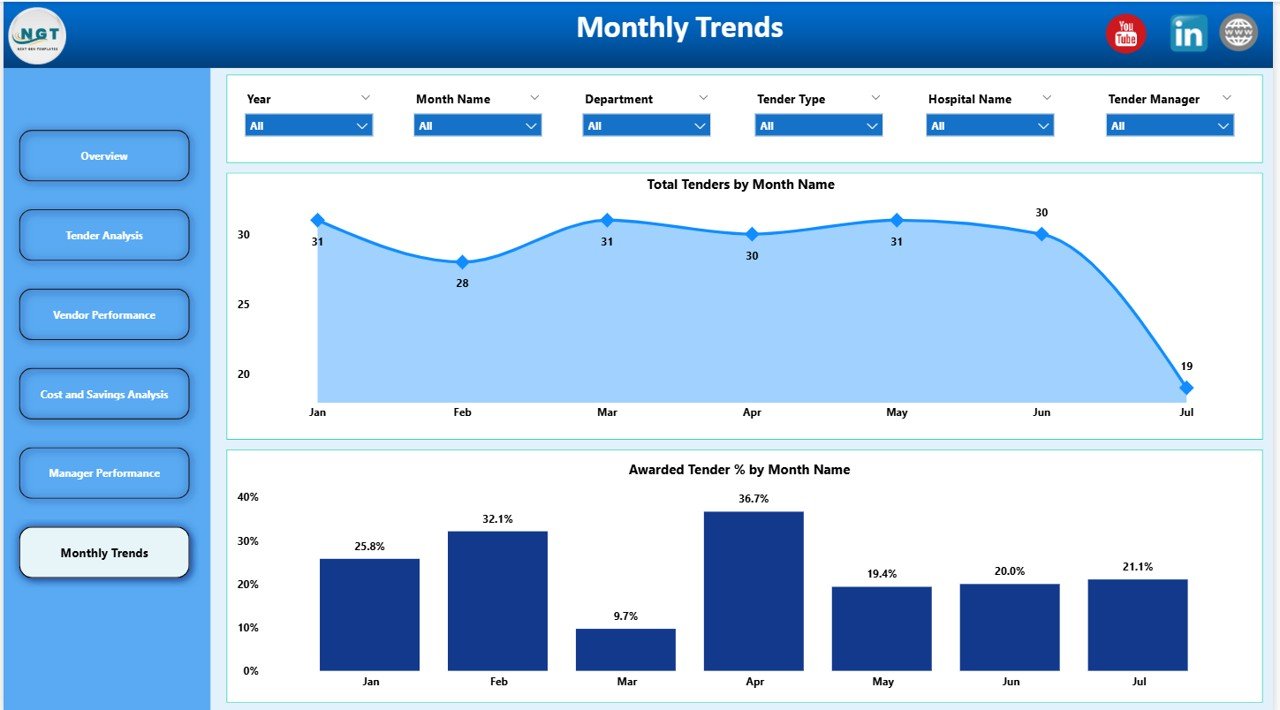
📅 Monthly Trends – Time-Based Tender Insights
This section highlights how tender activity changes over time.
Charts Included
-
Total Tenders by Month
-
Awarded Tender % by Month
These trends help organizations identify seasonal patterns and process improvements.
🎯 Who Can Benefit from This Dashboard
-
🏥 Hospitals & Healthcare Networks
-
📦 Procurement & Tender Management Teams
-
💼 Finance & Audit Teams
-
🧠 Compliance & Governance Teams
-
👩⚕️ Senior Management & Executives
📘 Click here to read the Detailed blog post
Watch the step-by-step video tutorial:


Reviews
There are no reviews yet.