Healthcare organizations manage multiple complex projects simultaneously. These projects range from hospital infrastructure upgrades and IT system implementations to medical equipment installations, compliance initiatives, and patient service improvement programs. Because healthcare budgets are tightly controlled and timelines are mission-critical, even small project delays or cost overruns can create operational and financial risk.
That is exactly why the Health Project Management Dashboard in Power BI becomes an essential analytics solution.
This ready-to-use Power BI dashboard transforms raw healthcare project data into clear, interactive, and actionable insights. Instead of relying on scattered spreadsheets and static reports, hospitals gain a centralized, real-time view of project progress, cost variance, risk exposure, manager performance, and monthly trends—all within one powerful dashboard.
Built on Power BI, this dashboard delivers enterprise-level analytics with interactive filters, drill-downs, and executive-ready visuals. As a result, hospital administrators, project managers, finance teams, and leadership can make faster decisions, reduce cost overruns, and strengthen project governance.
⚙️ Key Features of the Health Project Management Dashboard
📊 Centralized Project Visibility
Track all healthcare projects across hospitals, departments, and project types from one dashboard.
💰 Budget vs Actual Cost Monitoring
Instantly identify overspending and cost variance before issues escalate.
⚠️ Risk-Based Project Analysis
Monitor low, medium, and high-risk projects separately for proactive control.
👩💼 Project Manager Performance Tracking
Measure cost control and delivery efficiency at manager level.
📅 Monthly Trend Analysis
Understand how project costs and completion rates evolve over time.
📦 What’s Inside the Health Project Management Dashboard
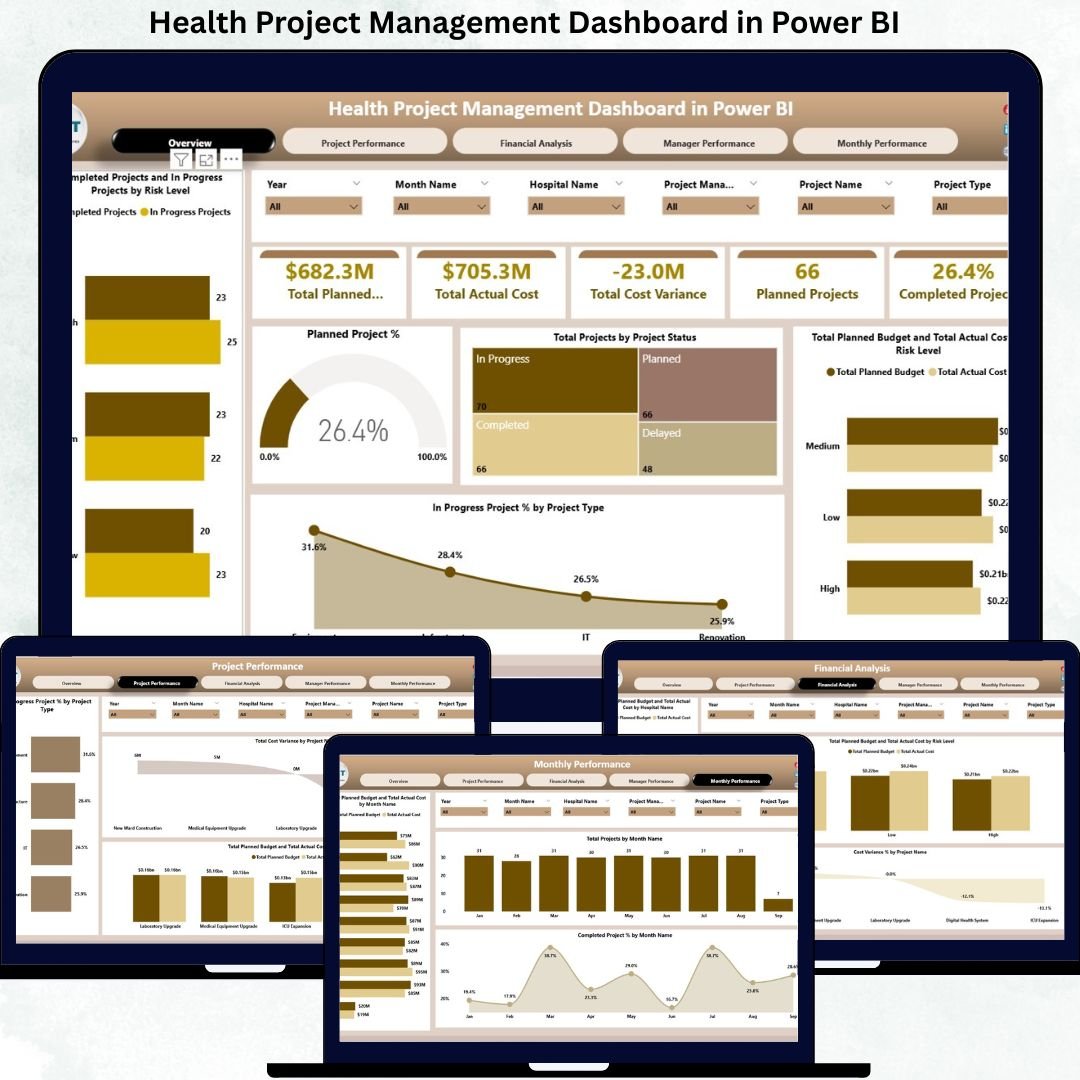
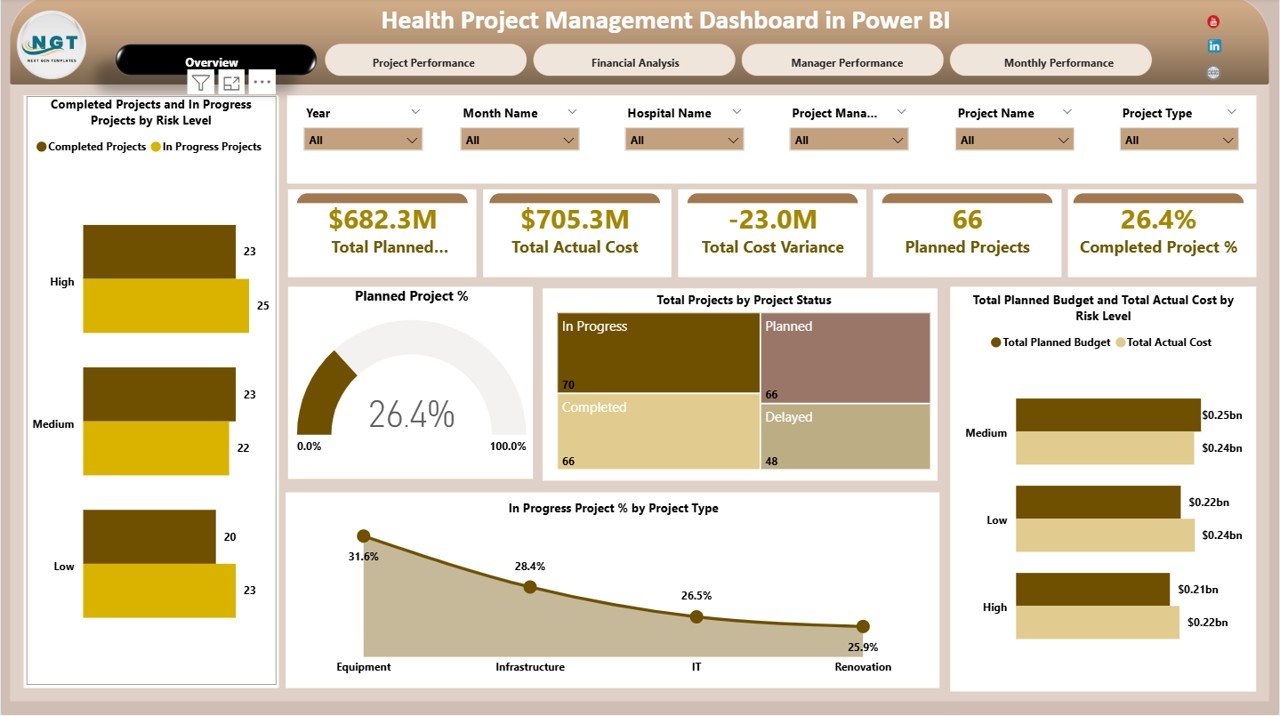
🖥️ Overview Section – Executive Project Summary
The Overview section gives leadership an instant snapshot of overall project health.
KPI Cards Included
-
Total Planned Budget – Approved budget for all projects
-
Total Actual Cost – Cost incurred to date
-
Total Cost Variance – Budget deviation
-
Planned Projects – Total approved projects
-
Completed Project % – Delivery progress indicator
Overview Charts
-
Completed vs In-Progress Projects by Risk Level
-
Planned Project %
-
Total Projects by Project Status
-
Planned Budget vs Actual Cost by Risk Level
-
In-Progress Project % by Project Type
These visuals help leadership focus immediately on high-risk and high-impact projects.
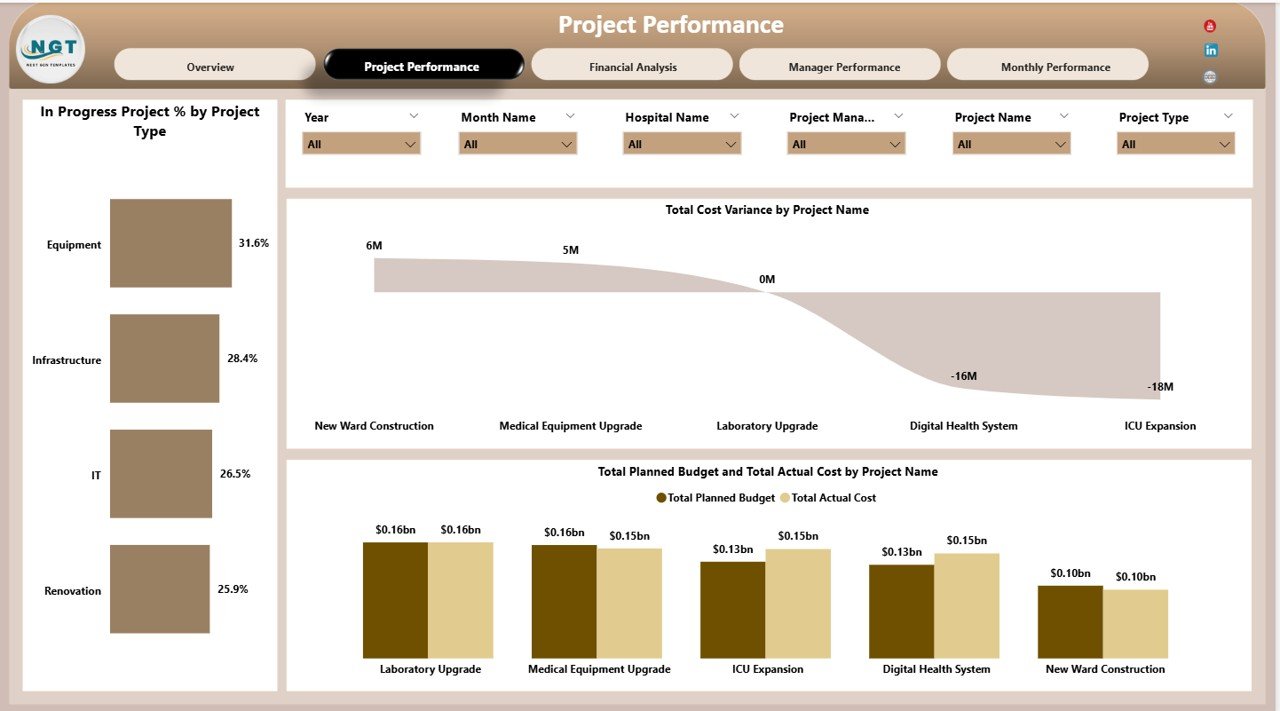
📊 Project Performance Analysis
This section focuses on individual project execution and budget discipline.
Charts Included
-
In-Progress Project % by Project Type
-
Total Cost Variance by Project Name
-
Planned Budget vs Actual Cost by Project Name
Project managers use this view to prioritize corrective actions and control overruns.
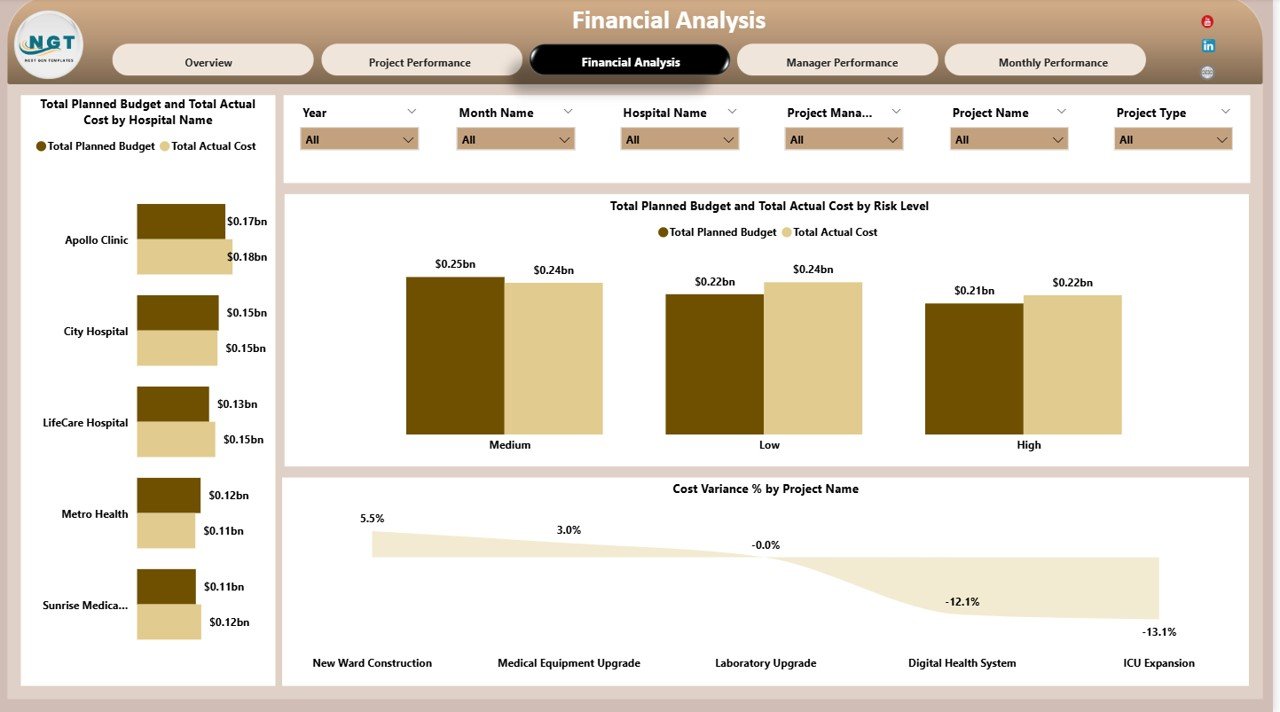
💰 Financial Analysis – Cost Governance
Healthcare projects require strict financial discipline.
Charts Included
-
Planned Budget vs Actual Cost by Hospital Name
-
Planned Budget vs Actual Cost by Risk Level
-
Cost Variance % by Project Name
Finance teams use this section for budget reviews, audits, and financial forecasting.
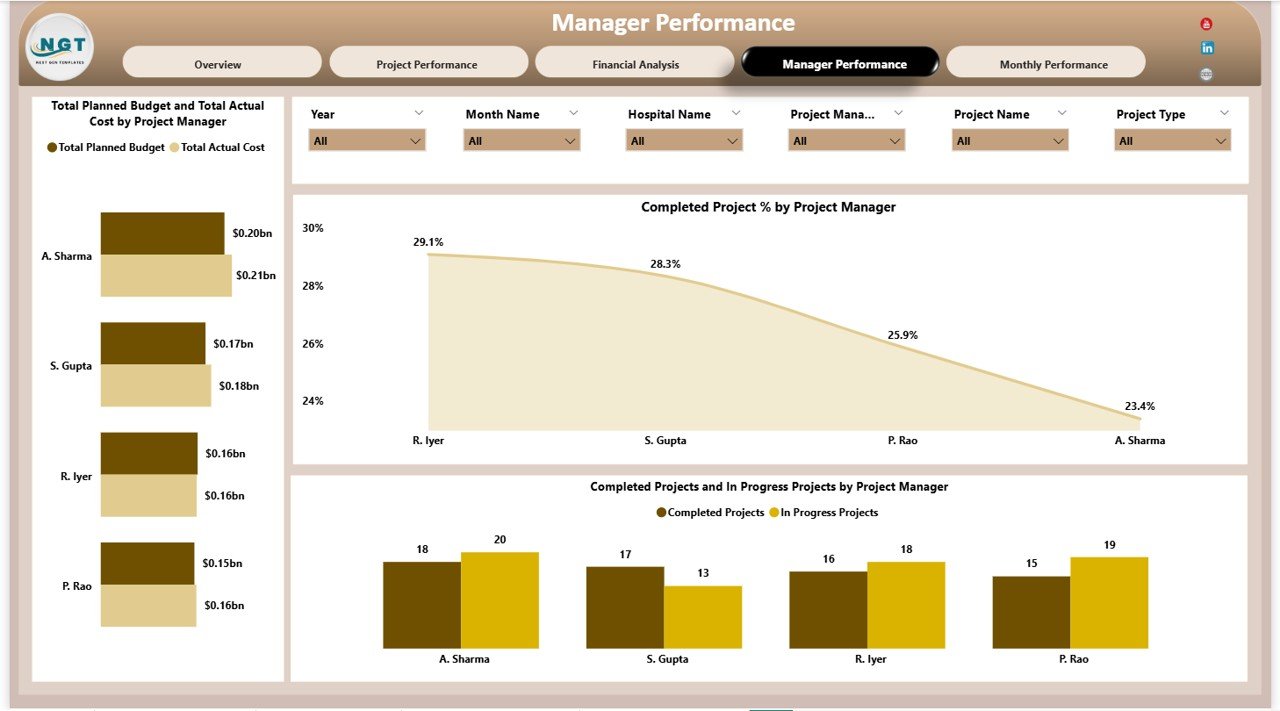
👩💼 Manager Performance Analysis
Strong leadership drives successful project delivery.
Charts Included
-
Planned Budget vs Actual Cost by Project Manager
-
Completed Project % by Project Manager
-
Completed vs In-Progress Projects by Manager
This analysis improves accountability and highlights coaching or support needs.
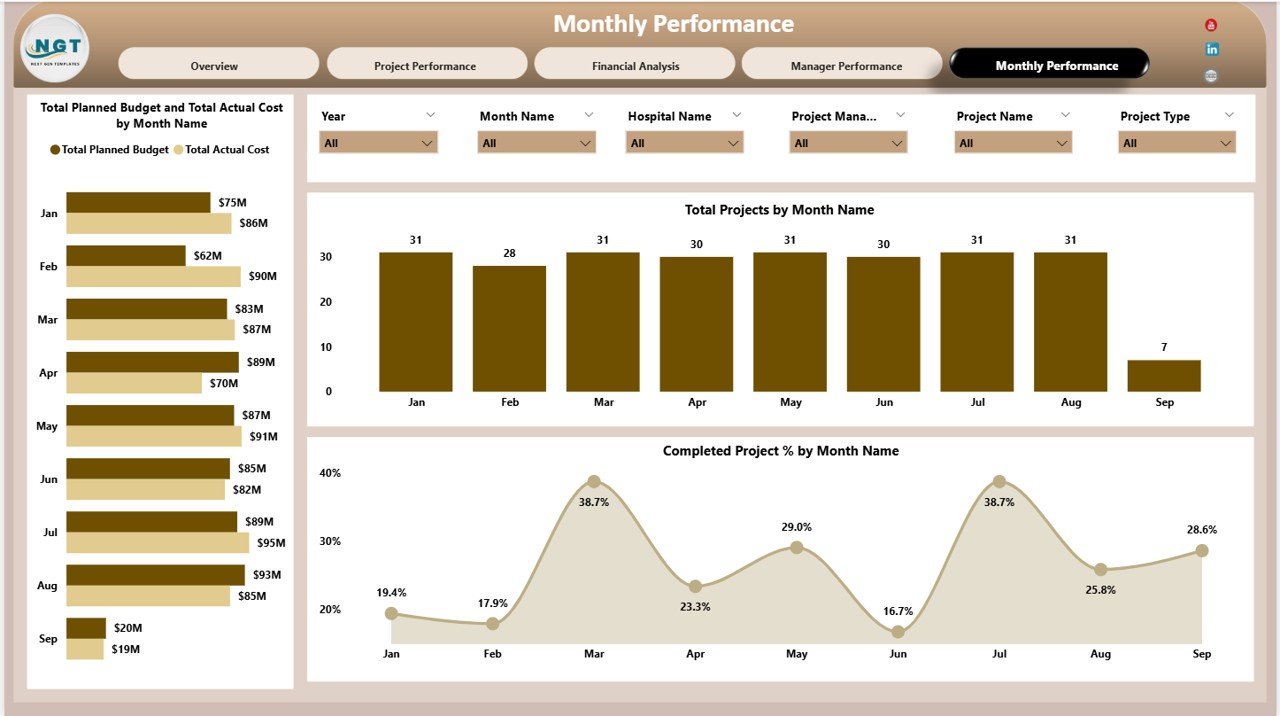
📅 Monthly Performance Trends
Time-based insights support forecasting and planning.
Charts Included
-
Planned Budget vs Actual Cost by Month
-
Total Projects by Month
-
Completed Project % by Month
Monthly trends help identify seasonal spending patterns and execution improvements.
🎯 Who Can Use This Dashboard
-
🏥 Hospitals & Healthcare Networks
-
📊 Project Management Offices (PMO)
-
💼 Finance & Budget Teams
-
👩⚕️ Hospital Administrators
-
🧠 Executive Leadership
Click here to Read detailed blog post
Watch the step-by-step video tutorial:


Reviews
There are no reviews yet.