


Digital marketing decisions cannot wait. Traffic changes daily. Campaign performance shifts quickly. Targets move constantly. Yet many teams still rely on scattered Google Analytics screens, manual exports, and static Excel reports. As a result, insights arrive late and actions lose impact.
That is exactly why the Google Analytics KPI Dashboard in Power BI becomes a high-impact analytics solution.
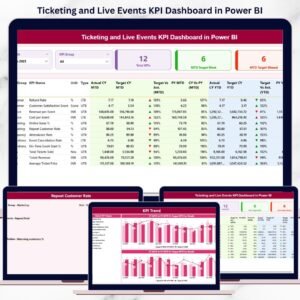
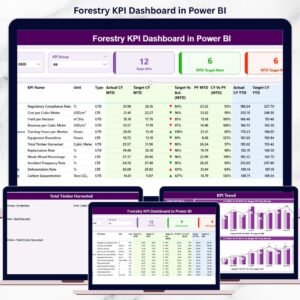
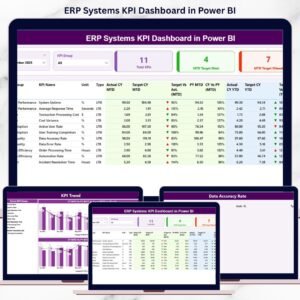
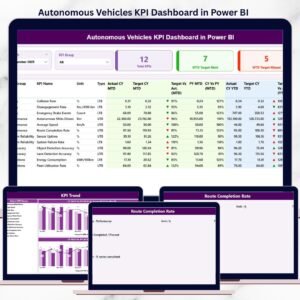
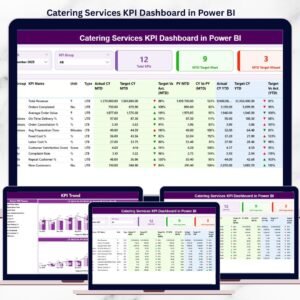
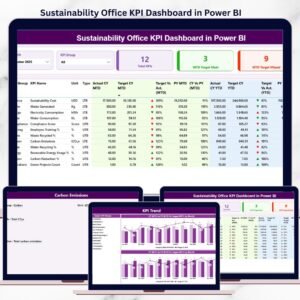
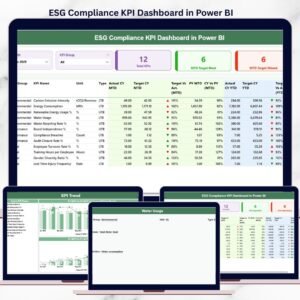
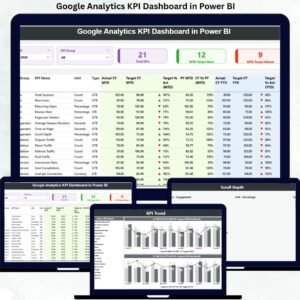
This ready-to-use, interactive Power BI dashboard converts raw Google Analytics data into clear KPIs, target comparisons, and trend insights—all in one centralized view. Instead of switching between multiple reports, marketers, analysts, and managers instantly see what is working, what is not, and where to focus next.
Built with Excel as the data source and Power BI as the visualization engine, this dashboard stays simple to update, easy to maintain, and powerful enough for strategic decision-making. As a result, teams gain speed, clarity, and confidence—without technical complexity.
🔑 Key Features of Google Analytics KPI Dashboard in Power BI
📌 Centralized KPI Monitoring
Track all website and digital marketing KPIs from one unified Power BI dashboard.
🎯 Target vs Actual Performance Tracking
Instantly identify which KPIs meet or miss targets using percentages and visual indicators.
📈 MTD & YTD Analysis
Monitor Month-to-Date and Year-to-Date performance side by side.
🔄 Current Year vs Previous Year Comparison
Understand growth trends with CY vs PY performance analysis.
📊 Interactive Summary Table
Analyze detailed KPI-level data with icons, percentages, and comparisons.
📉 Trend Analysis with Combo Charts
Visualize performance movement using bar-and-line trend charts.
📘 Built-In KPI Definitions
Maintain clarity with drill-through KPI definitions, formulas, and units.
⚡ Excel-Based Data Updates
Update KPI data easily in Excel and refresh Power BI in seconds.
📂 What’s Inside the Google Analytics KPI Dashboard in Power BI

📁 Summary Page – High-level KPI overview with slicers, cards, and detailed KPI table
📁 KPI Trend Page – Visual trend analysis for MTD and YTD performance
📁 KPI Definition Page – Governance page explaining KPI logic and calculations
📊 Excel Data Source Includes
• Input_Actual Sheet
• Input_Target Sheet
• KPI Definition Sheet
Together, these components deliver a complete, structured KPI reporting system.
🛠️ How to Use the Google Analytics KPI Dashboard in Power BI
1️⃣ Maintain actual KPI values in the Excel input file
2️⃣ Enter target KPI values in the target sheet
3️⃣ Open the Power BI dashboard
4️⃣ Click Refresh to update all visuals
5️⃣ Use Month and KPI Group slicers for focused analysis
6️⃣ Review KPI cards and detailed tables
7️⃣ Analyze trends and drill into KPI definitions
No advanced Power BI skills required. The dashboard is designed for quick adoption and daily use.
👥 Who Can Benefit from This Google Analytics KPI Dashboard in Power BI
📣 Digital marketing teams
📊 Marketing analysts
🧠 Growth and performance teams
🏢 Business managers and leadership
📈 SEO and paid media teams
🚀 Startups, agencies, and enterprises
If your business depends on website performance and digital growth, this dashboard delivers immediate value.
📘 Click here to read the Detailed blog post
🎥 Visit our YouTube channel to learn step-by-step video tutorials
👉 YouTube Channel


Reviews
There are no reviews yet.