The gig economy is exploding. Freelancers, delivery partners, ride-share drivers, creators, and independent contractors are driving a new wave of flexible income. Gig Economy KPI Scorecard in Excel but here’s the truth — flexibility without performance tracking leads to chaos.
If you run a gig platform, freelance marketplace, delivery network, or on-demand service, you must monitor revenue, fulfillment rate, worker retention, and customer satisfaction consistently. Otherwise, small inefficiencies can silently reduce profitability.
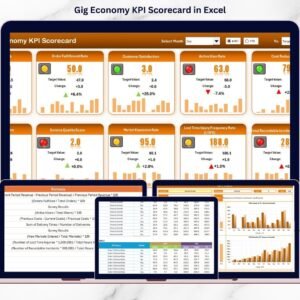
Gig Economy KPI Scorecard in Excel That’s exactly why you need the Gig Economy KPI Scorecard in Excel — a ready-to-use, interactive performance management system built specifically for gig-based businesses.
This powerful Excel template helps you track KPIs, compare actual vs target, monitor MTD and YTD results, and analyze trends — all in one structured dashboard.
Stop guessing. Start measuring. 📊
🚀 Key Features of Gig Economy KPI Scorecard in Excel
This scorecard is designed to give you complete performance visibility in minutes.
✅ Interactive Scorecard Dashboard
View all KPIs in one clean interface with automatic updates.
✅ Month Selection Dropdown
Easily switch between months and instantly refresh the dashboard.
✅ MTD & YTD Performance Tracking
Monitor both short-term and long-term performance trends.
✅ Actual vs Target vs Previous Year Comparison
Quickly identify performance gaps and growth patterns.
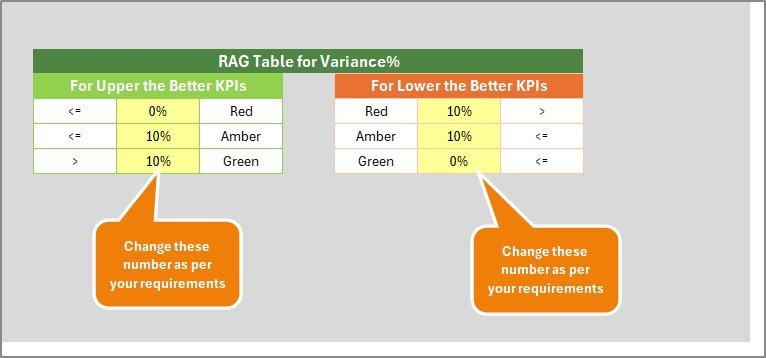
✅ Visual Performance Indicators
Color-coded signals, arrows, and conditional formatting highlight improvement or decline instantly.
✅ KPI Trend Analysis Sheet
Select any KPI and analyze detailed monthly trends with charts.
✅ Structured Input Data Sheet
Enter actual and target data easily using organized tables.
✅ KPI Definition Sheet
Standardize formulas and definitions to avoid confusion across departments.
This is not just a spreadsheet — it is a decision-making tool.
📦 What’s Inside the Gig Economy KPI Scorecard
This ready-to-use Excel template includes 4 structured worksheets:
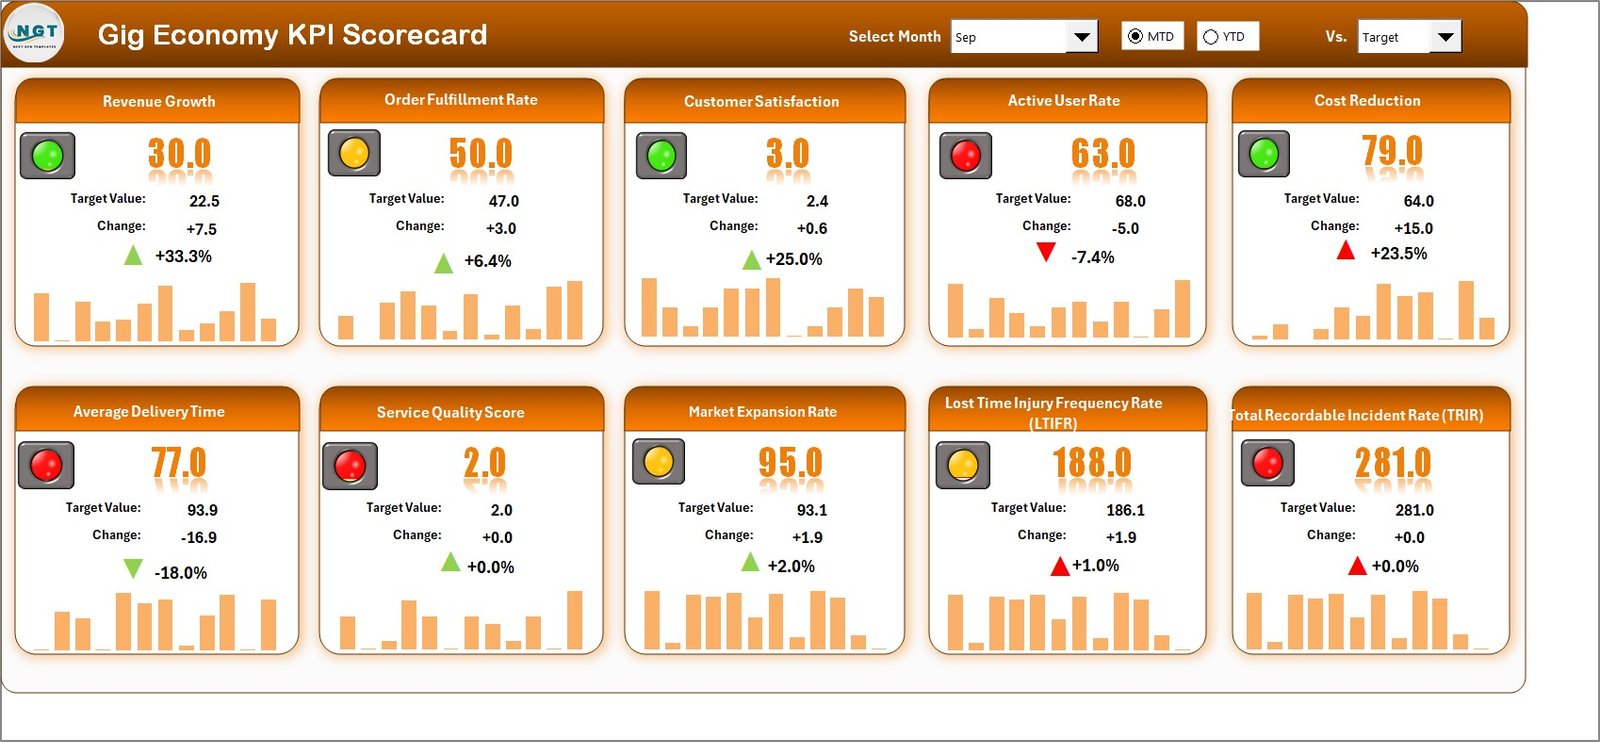
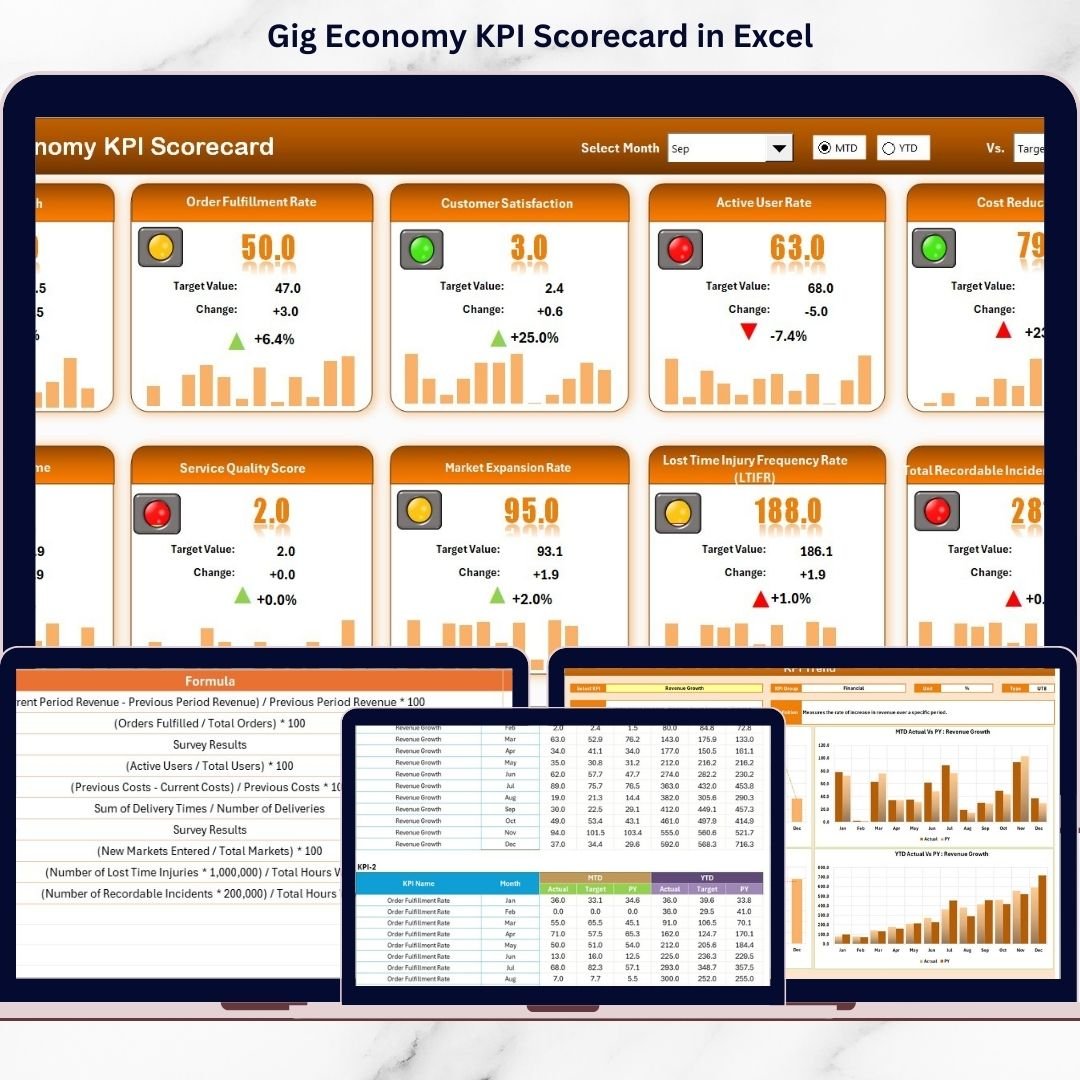
📊 1. Scorecard Sheet
The main dashboard where you can see all KPI performance in one place. Select Month, MTD, or YTD and the numbers update automatically.
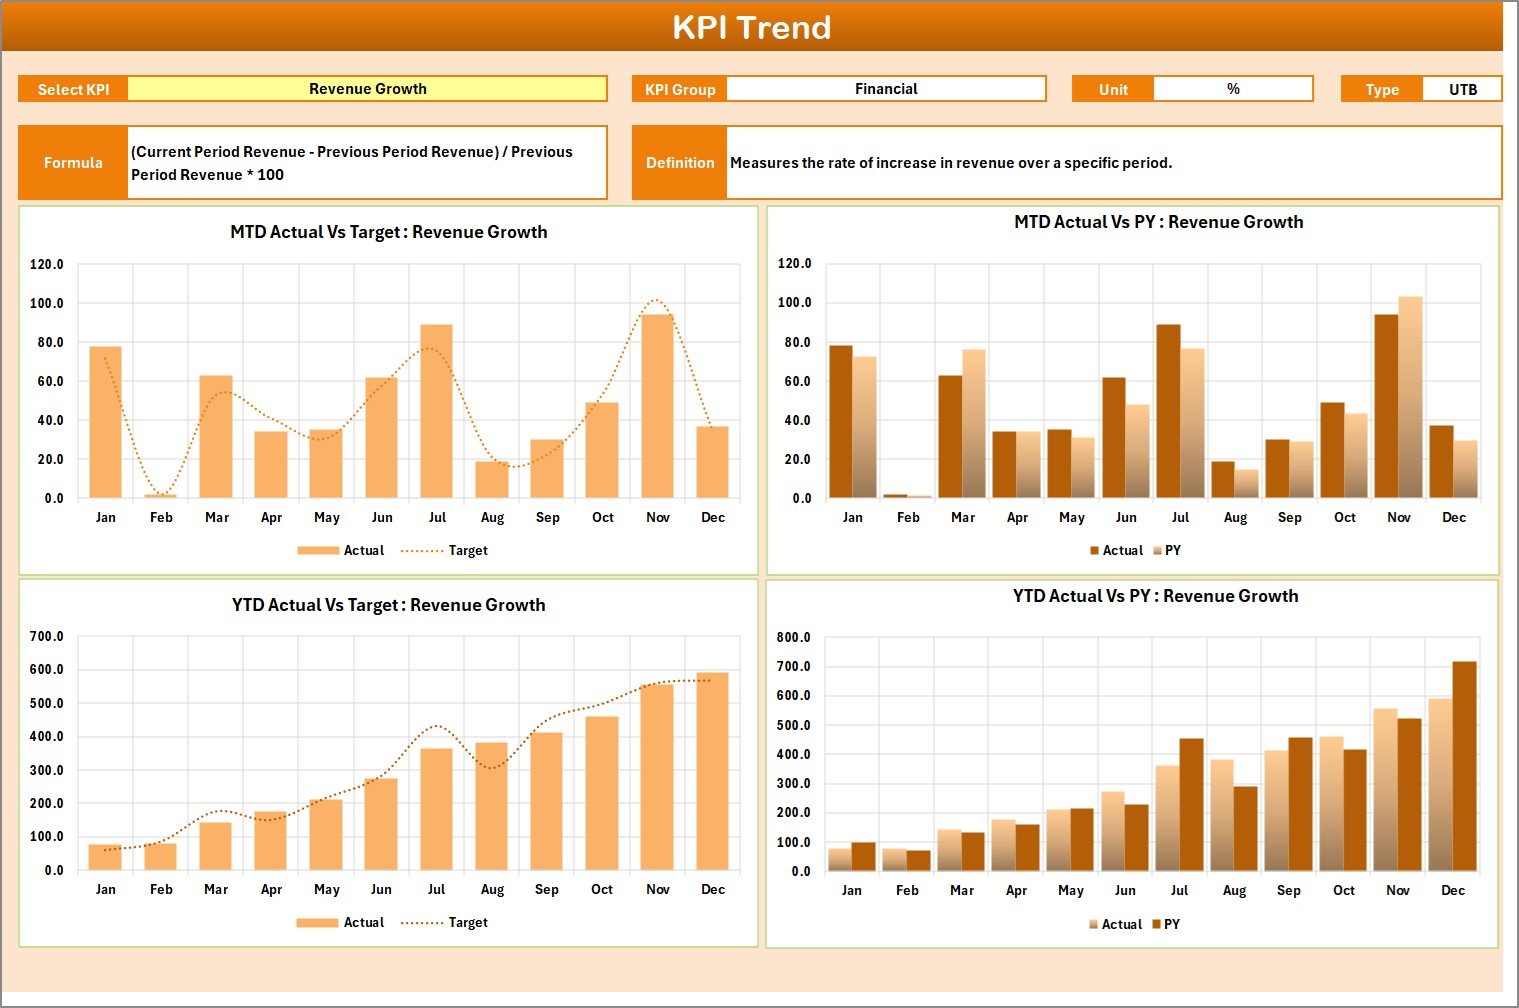
📈 2. KPI Trend Sheet
Analyze individual KPI performance over time. View MTD and YTD trend charts, KPI formula, definition, and performance comparison.
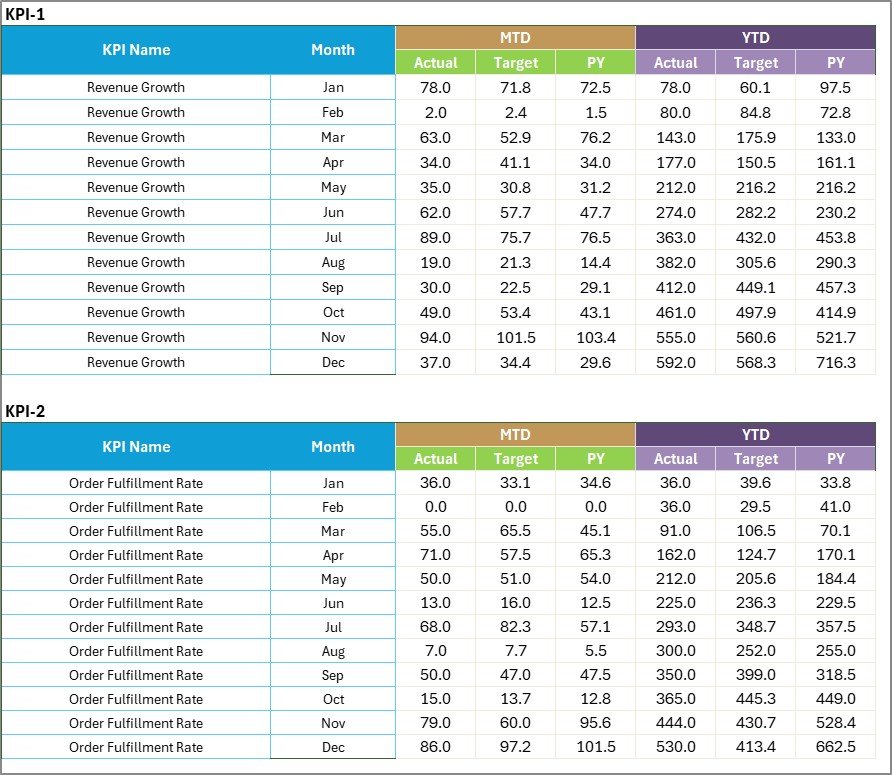
📝 3. Input Data Sheet
Enter monthly actual and target values. Once updated, the dashboard refreshes automatically.
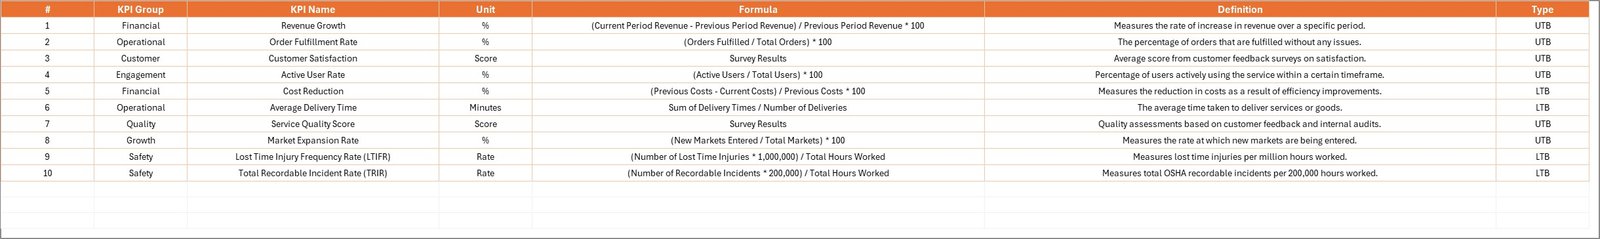
📘 4. KPI Definition Sheet
Define KPI Name, Group, Unit, Formula, and Definition to maintain consistency and clarity.
Everything is structured. Everything is automated. Everything is easy.
⚙️ How to Use the Gig Economy KPI Scorecard
Using this template is simple:
1️⃣ Enter your monthly actual and target data in the Input Sheet.
2️⃣ Select the month from the dropdown in the Scorecard Sheet.
3️⃣ Review MTD and YTD comparisons.
4️⃣ Analyze trends from the KPI Trend Sheet.
5️⃣ Identify weak areas and take action.
No advanced Excel skills required. Basic knowledge is enough to operate this template effectively.
Within minutes, you will gain clarity on:
-
Revenue Growth
-
Order Fulfillment Rate
-
Customer Satisfaction
-
Worker Retention
-
Platform Commission
-
Cost Efficiency
Make faster decisions. Reduce losses. Improve profitability.
🎯 Who Can Benefit from This Gig Economy KPI Scorecard
This template is perfect for:
🚚 Delivery & Logistics Platforms
🚗 Ride-Sharing Companies
💻 Freelance Marketplaces
📱 On-Demand Service Apps
📦 E-commerce Gig Networks
🎥 Creator Economy Platforms
📊 Operations & Finance Managers
🚀 Gig Startups & Scaling Businesses
Whether you manage 50 workers or 50,000, this scorecard scales with your growth.
The gig economy moves fast. Your reporting system should move faster.
Instead of scattered spreadsheets and manual calculations, use one powerful Excel-based KPI scorecard to monitor financial, operational, customer, and workforce performance in one place.
When you track KPIs consistently, you:
✔ Detect performance gaps early
✔ Improve worker engagement
✔ Increase customer satisfaction
✔ Optimize operational costs
✔ Strengthen profit margins
Turn data into direction. Turn insights into action.
Click hare to read the Detailed blog post
Visit our YouTube channel to learn step-by-step video tutorials:
👉 https://www.youtube.com/@PKAnExcelExpert
Watch the step-by-step video tutorial: