Gene therapy programs operate in one of the most complex and data-intensive environments in modern life sciences. Research efficiency, clinical timelines, manufacturing quality, cost control, and compliance must all be monitored continuously. However, many organizations still rely on fragmented spreadsheets and manual reports, making it difficult to track performance accurately and consistently.Gene Therapy KPI Dashboard in Google Sheets
That is exactly why the Gene Therapy KPI Dashboard in Google Sheets becomes a powerful, ready-to-use performance management solution.Gene Therapy KPI Dashboard in Google Sheets
This professionally designed KPI dashboard transforms raw gene therapy performance data into clear, structured, and actionable insights. It allows research teams, biotech companies, and life-science organizations to monitor KPIs across experiments, trials, production, and quality functions—without complex tools, coding, or expensive BI platforms.
Because the dashboard is built entirely in Google Sheets, it is cloud-based, collaborative, and easy to maintain. Teams can update data, review performance, and share insights in real time, ensuring transparency and alignment across stakeholders.
🚀 Key Features of the Gene Therapy KPI Dashboard
📊 Centralized KPI Performance Monitoring
Track all critical gene therapy KPIs in one place, including:
-
MTD (Month-to-Date) performance
-
YTD (Year-to-Date) performance
-
Target vs Actual comparison
-
Previous Year vs Actual comparison
This structure supports both short-term operational monitoring and long-term strategic evaluation.
📂 Dashboard Structure – 6 Structured Worksheets
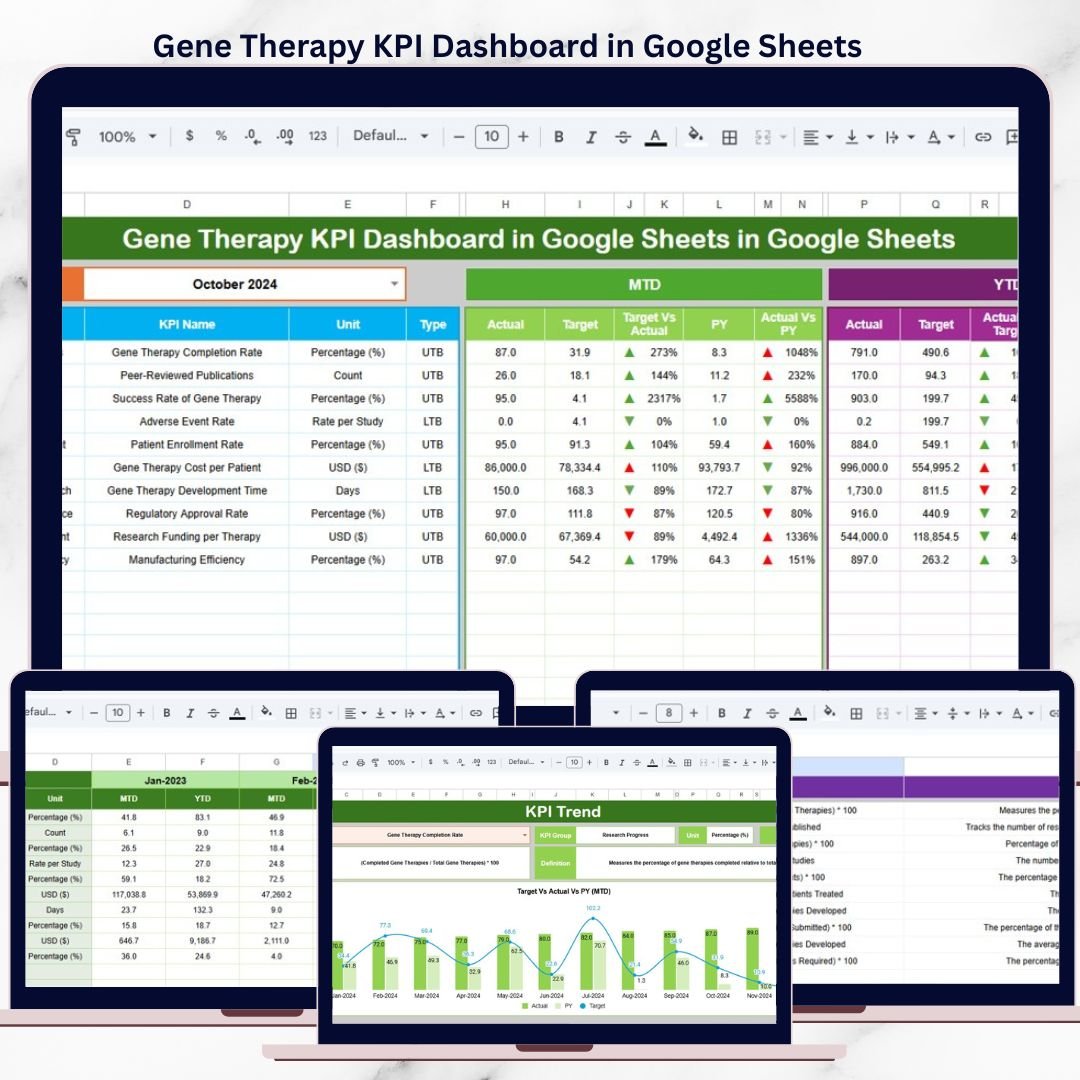
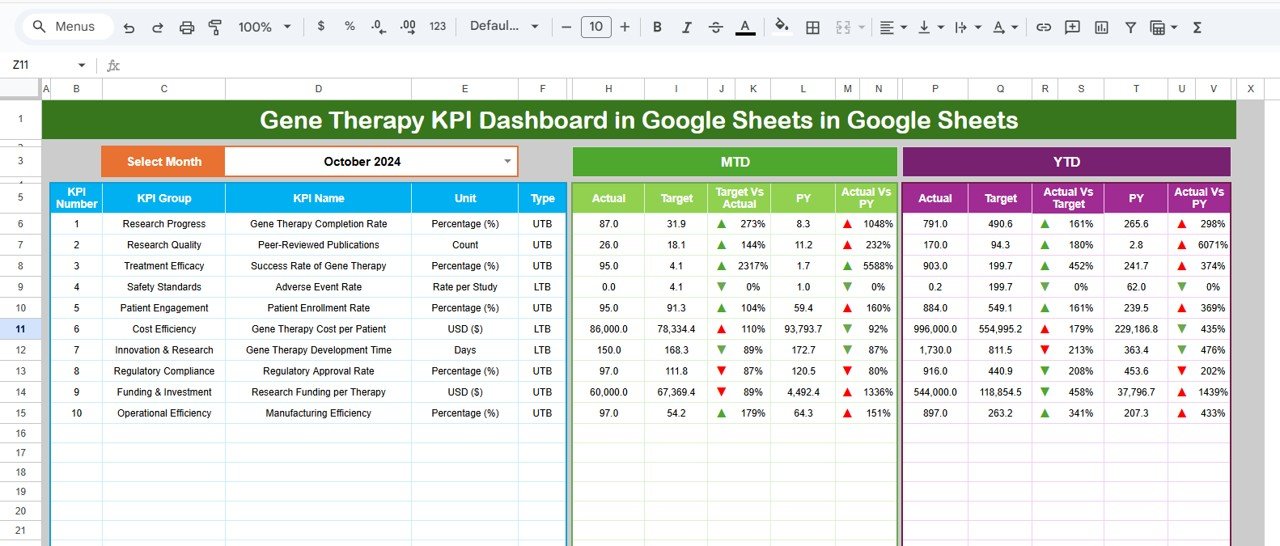
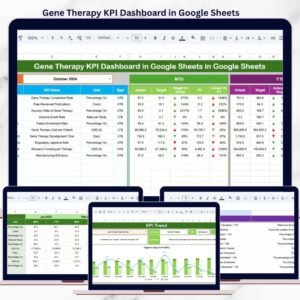
🏠 1. Dashboard Sheet – Executive KPI Overview
This is the main dashboard where all KPIs are displayed together.
Key Capabilities
-
Month selector available in Cell D3
-
Automatic refresh of all KPIs when the month changes
-
Displays:
-
MTD Actual, Target, Previous Year
-
YTD Actual, Target, Previous Year
-
-
Built-in variance analysis:
-
Target vs Actual
-
Previous Year vs Actual
-
-
Conditional formatting with:
-
🔺 Up arrows for improvement
-
🔻 Down arrows for decline
-
This sheet is ideal for leadership reviews, portfolio meetings, and monthly performance discussions.
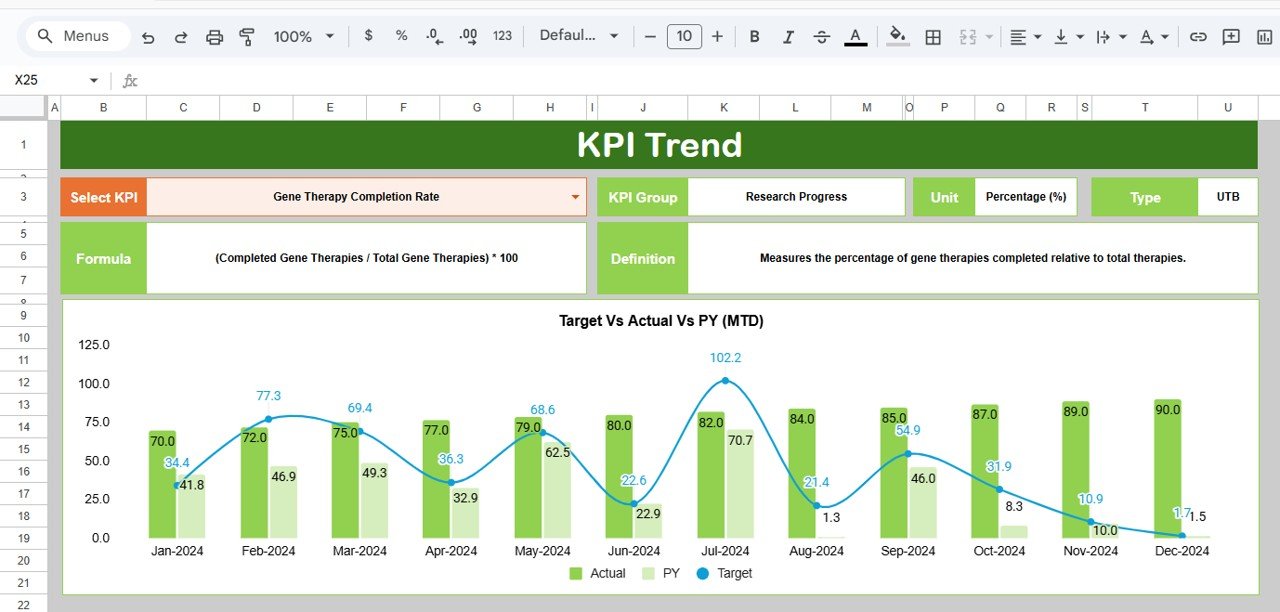
📈 2. KPI Trend Sheet – KPI-Wise Deep Dive
This sheet provides detailed context for individual KPIs.
How It Works
-
Select a KPI from the dropdown in Cell C3
-
Automatically displays:
-
KPI Group
-
Unit of Measurement
-
KPI Type (Upper the Better / Lower the Better)
-
KPI Formula
-
KPI Definition
-
This ensures complete transparency and shared understanding of every KPI being tracked.
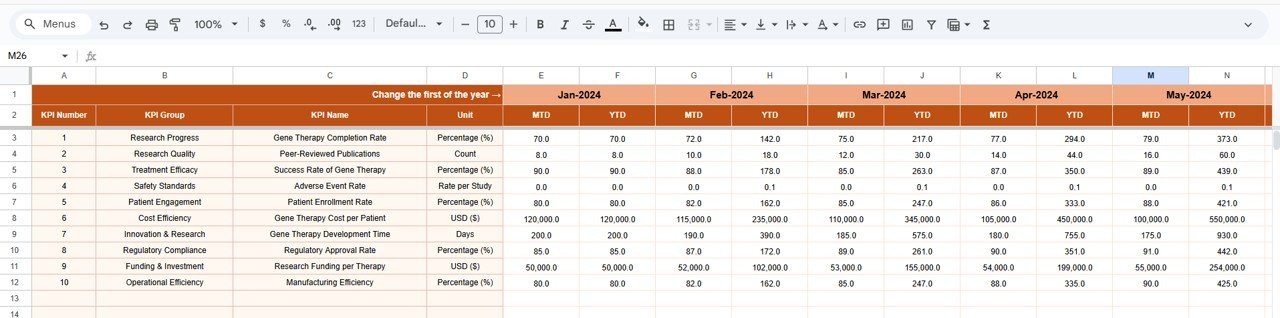
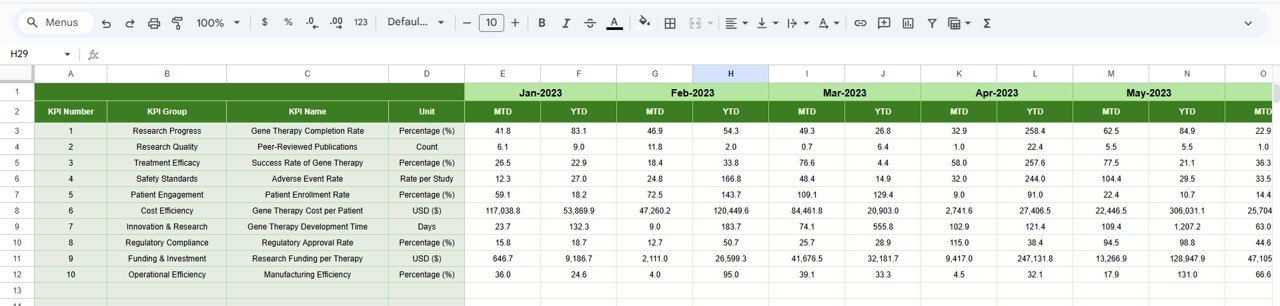
🧾 3. Actual Number Sheet – Current Year Data Entry
This sheet is used to enter actual KPI performance data.
Key Features
-
Enter MTD and YTD actual values
-
Month selection available in Cell E1
-
Only the first month of the year needs to be defined once
-
All calculations update automatically
This keeps data entry simple, controlled, and error-free.
🎯 4. Target Sheet – KPI Goal Setting
The Target Sheet stores planned KPI values.
What You Define
-
Monthly (MTD) targets
-
Cumulative (YTD) targets
These targets feed directly into:
-
Dashboard variance calculations
-
Performance indicators
-
Trend analysis
This ensures alignment between research goals, operational targets, and leadership expectations.
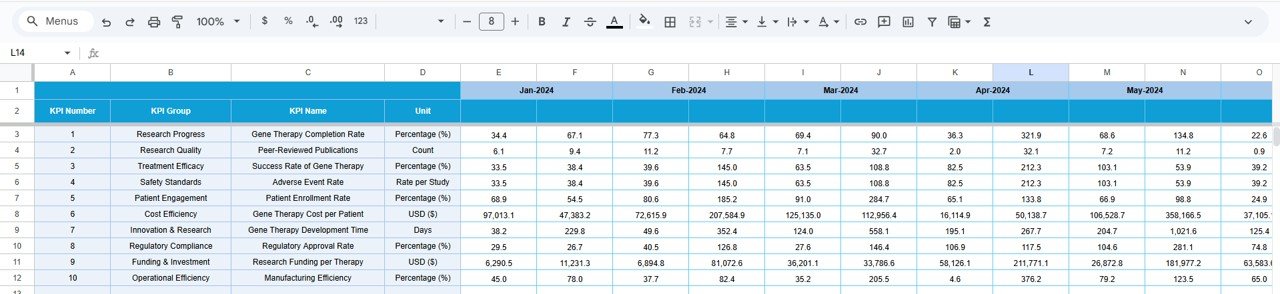
📊 5. Previous Year Number Sheet – Historical Comparison
This sheet captures last year’s KPI values.
Purpose
-
Enables year-over-year performance comparison
-
Highlights growth, decline, and long-term trends
-
Automatically drives PY vs Actual variance calculations
This is especially useful for program maturity analysis and regulatory reporting.
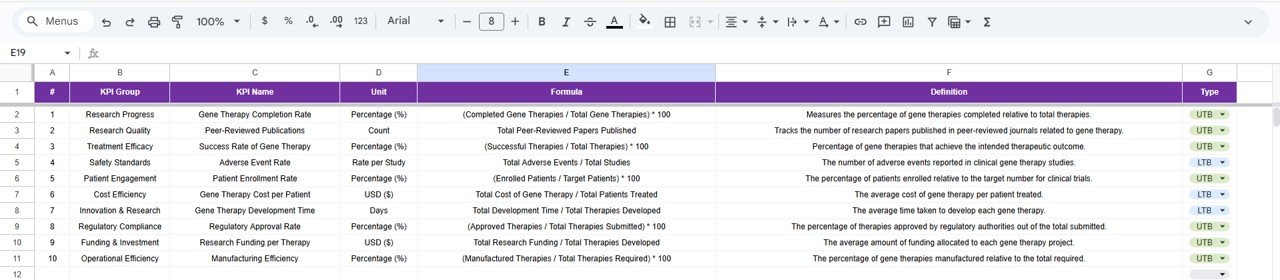
📚 6. KPI Definition Sheet – KPI Master Table
This is the backbone of the entire dashboard.
Columns Included
-
KPI Name
-
KPI Group
-
Unit
-
Formula
-
KPI Definition
-
KPI Type (UTB / LTB)
Centralizing KPI logic ensures consistency, governance, and audit readiness.
🎯 Advantages of the Gene Therapy KPI Dashboard
-
Centralized KPI tracking in one file
-
Saves hours of manual reporting
-
Clear target and year-over-year comparison
-
Supports research, clinical, manufacturing, and quality KPIs
-
Cloud-based and team-friendly
-
Reusable across programs and years
👥 Who Can Use This Dashboard?
-
Gene Therapy Research Teams
-
Biotech & Pharmaceutical Companies
-
Clinical Operations Teams
-
Quality & Compliance Teams
-
Life-Science Analysts
-
Program & Portfolio Managers
### Click here to read the Detailed blog post
Watch the step-by-step video tutorial:


Reviews
There are no reviews yet.