Running a furniture retail business today requires more than selling sofas, beds, and dining tables. Retailers must constantly monitor sales, profit, discounts, costs, inventory movement, store performance, regional trends, and seasonality. However, when this information sits in scattered spreadsheets or manual reports, critical insights often go unnoticed.
That is exactly where the Furniture Retail Dashboard in Excel becomes a powerful decision-making tool 🪑📊.
This ready-to-use Excel dashboard transforms raw retail data into clear KPIs, interactive charts, and dynamic insights. Instead of spending hours compiling reports, business owners and managers can instantly see what is working, what is not, and where action is required. Built entirely in Excel, this dashboard delivers professional analytics without complex tools or heavy IT dependency.
Whether you manage a single showroom or multiple stores across regions, this dashboard helps you stay in control of performance and profitability.
## Key Features of Furniture Retail Dashboard in Excel 🚀
This dashboard is designed to give furniture retailers instant clarity and control.
📊 Centralized Retail Performance View
Track sales, profit, cost, quantity, and discounts in one structured Excel dashboard.
🎛️ Interactive Right-Side Slicers
Filter performance instantly by month, store, region, product category, or salesperson.
📈 Executive KPI Cards
Get a quick snapshot of key performance metrics at a glance.
📉 Discount & Cost Control Insights
Identify over-discounted stores, regions, or product categories easily.
🏬 Store-Wise Performance Analysis
Compare sales, profit, quantity, and cost across multiple stores.
🌍 Region-Wise Performance Tracking
Understand how different regions contribute to revenue and profitability.
📅 Monthly Trend Analysis
Track seasonal demand, profit trends, and cost patterns over time.
💡 100% Excel-Based Solution
No BI tools required—simple, familiar, and easy to maintain.
## What’s Inside the Furniture Retail Dashboard in Excel 📂
This dashboard includes multiple professionally designed analysis pages, each focused on a specific business question.
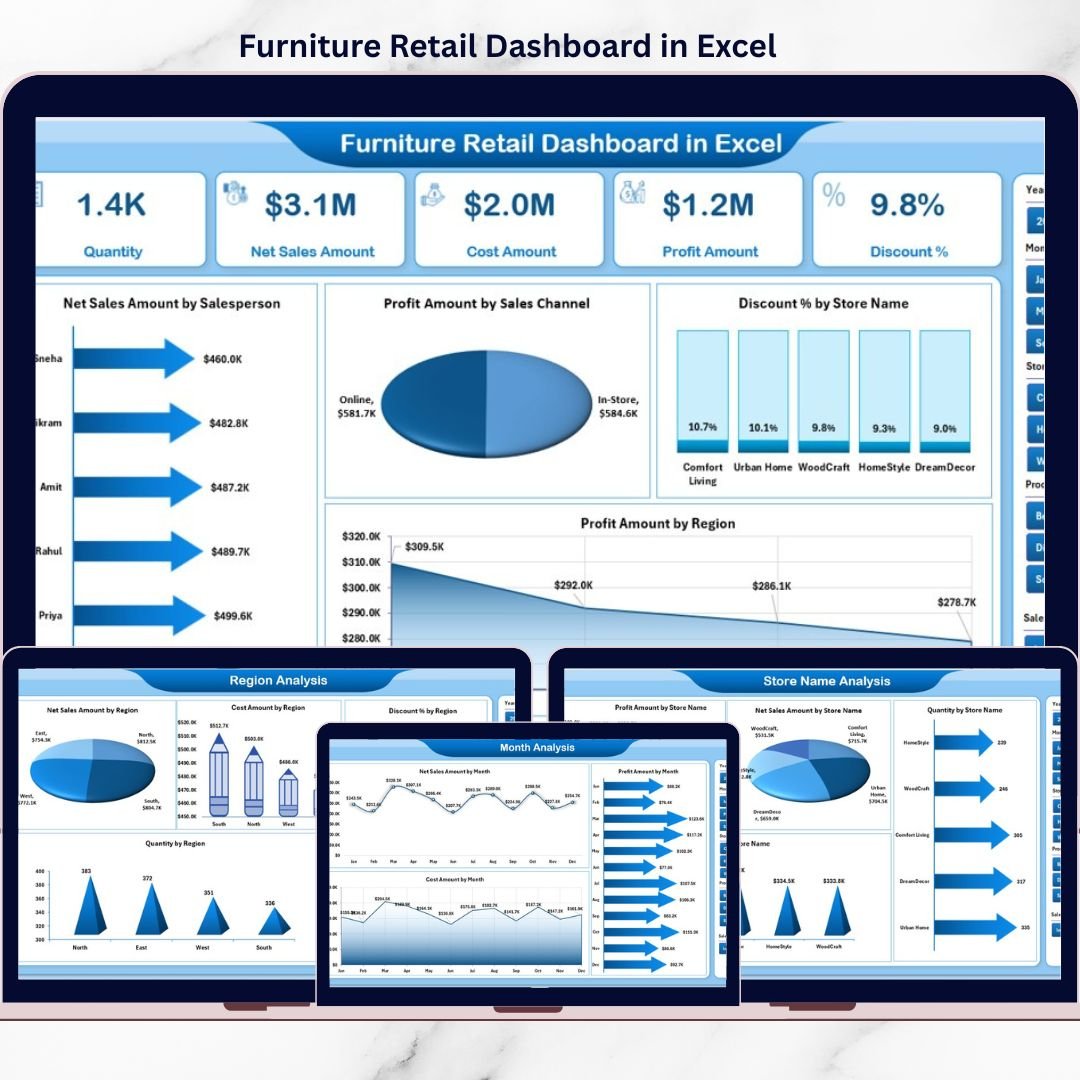
🟦 Overview Page
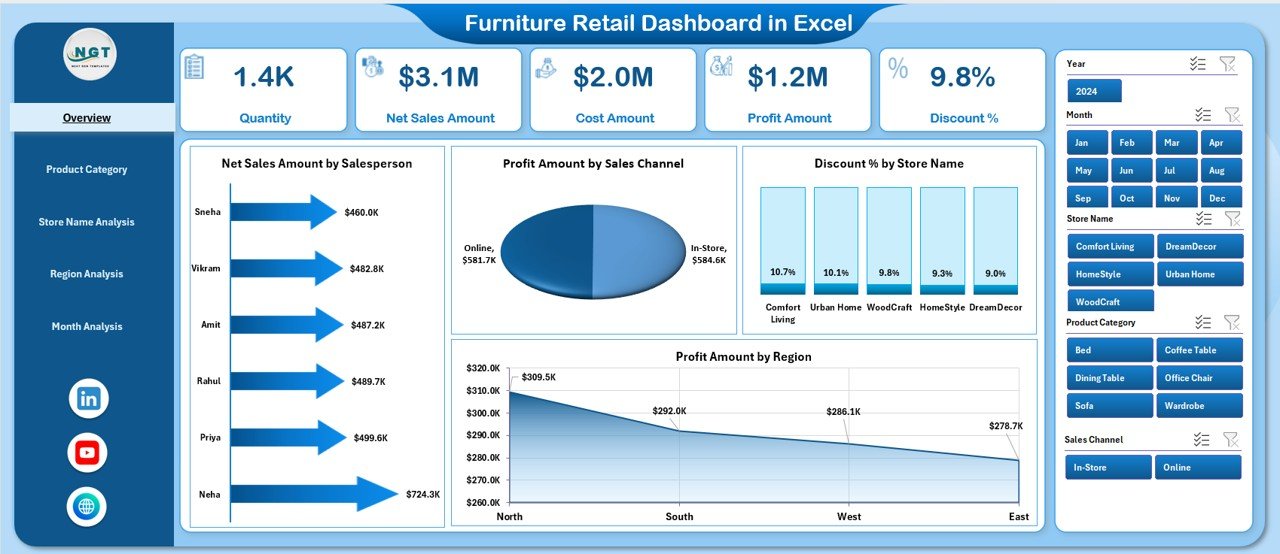
Acts as the command center with KPI cards and high-level charts showing sales, profit, discounts, and regional performance.
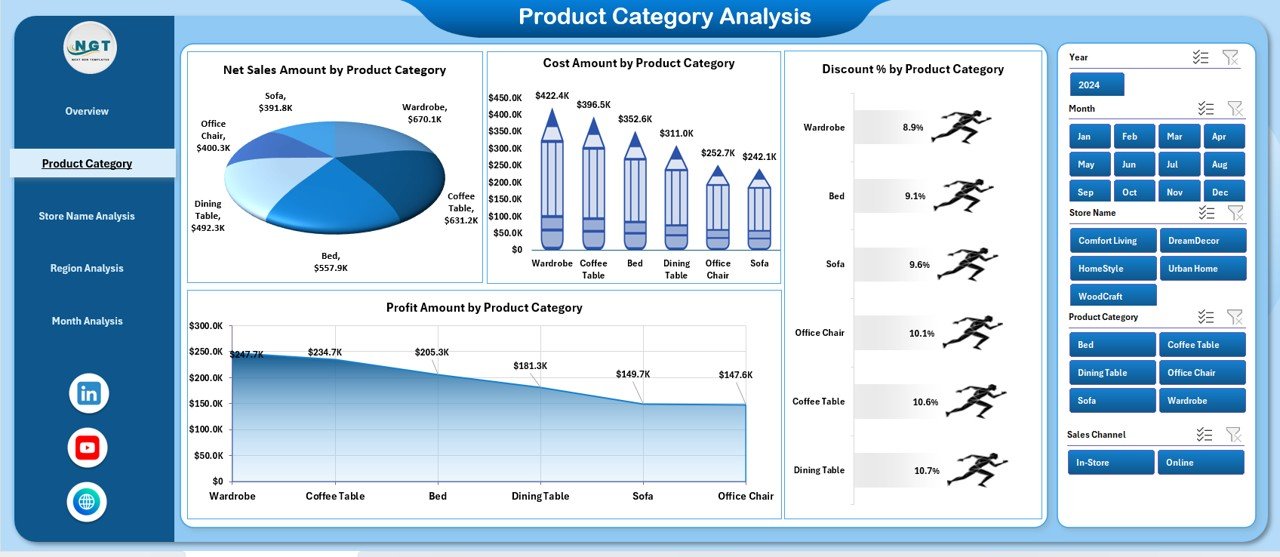
🟦 Product Category Analysis Page
Analyzes net sales, profit, discount %, and cost across furniture categories to understand product mix performance.
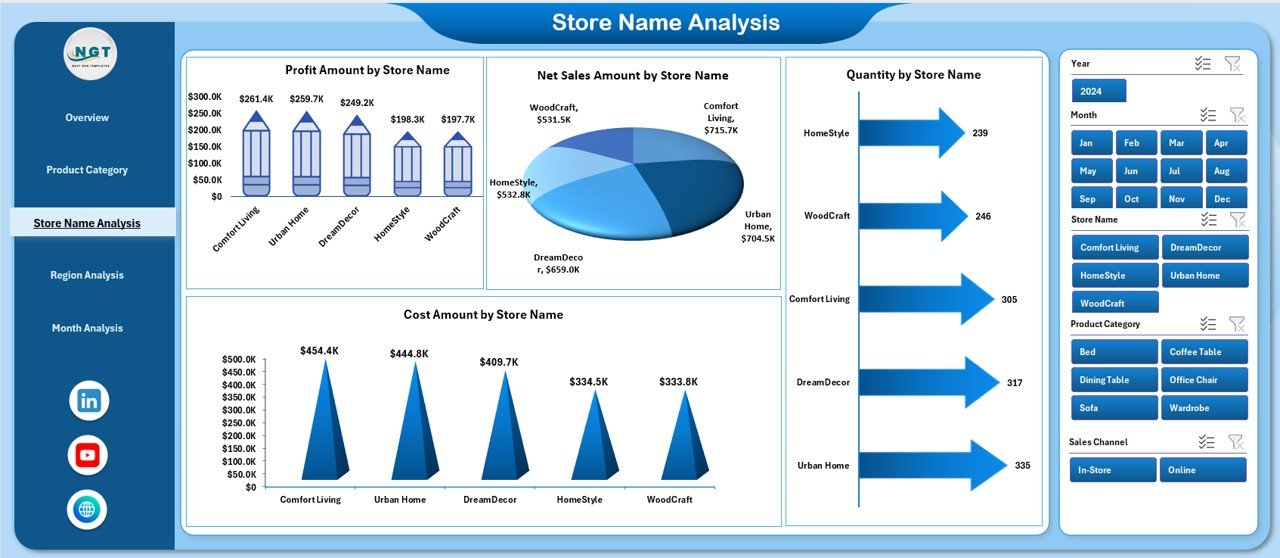
🟦 Store Name Analysis Page
Compares store-wise sales, profit, quantity, and cost to identify top-performing and underperforming locations.
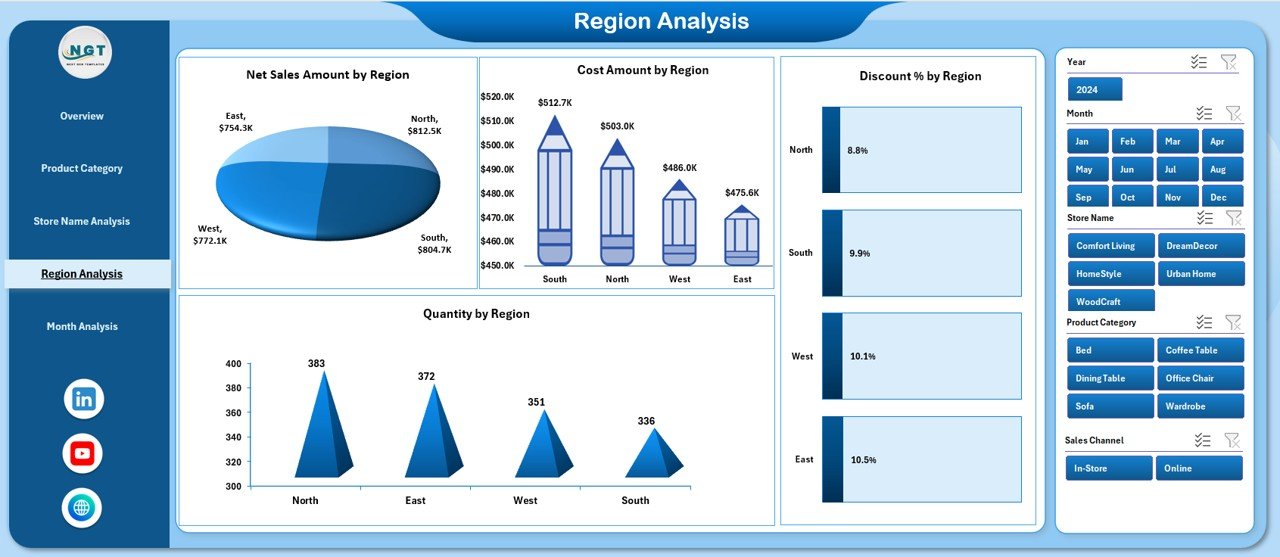
🟦 Region Analysis Page
Provides regional insights for sales, discounts, quantity, and cost to support expansion and optimization strategies.
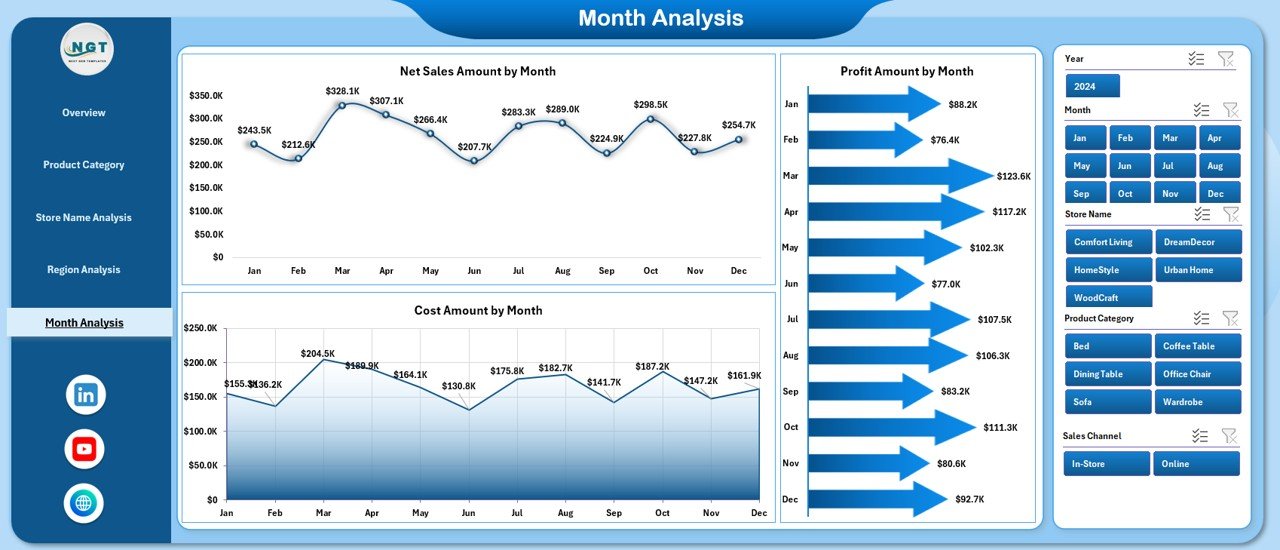
🟦 Month Analysis Page
Tracks monthly trends for sales, profit, and cost, helping retailers manage seasonality and forecasting.
🟦 Data Sheet
Stores raw transactional data such as store, region, category, salesperson, sales amount, profit, cost, discount %, and quantity.
🟦 Support Sheet
Handles background calculations, mappings, and helper logic to keep the dashboard clean and scalable.
Together, these sheets create a complete furniture retail analytics system.
## How to Use the Furniture Retail Dashboard in Excel 🧩
Using this dashboard is simple and business-friendly:
1️⃣ Update your transactional data in the Data Sheet
2️⃣ Refresh Pivot Tables if needed
3️⃣ Use slicers to filter by store, region, category, or month
4️⃣ Review KPI cards and charts instantly
5️⃣ Use insights to improve pricing, discounting, and operations
Excel automatically updates all visuals, allowing teams to focus on action, not reporting.
## Who Can Benefit from This Furniture Retail Dashboard in Excel 👥
This dashboard is ideal for:
✔️ Furniture Retail Business Owners
✔️ Store & Regional Managers
✔️ Sales & Operations Teams
✔️ Finance & Profitability Analysts
✔️ Retail Consultants
✔️ Business Analysts
Because it is Excel-based, both technical and non-technical users can use it confidently.
### Click here to read the Detailed blog post
Visit our YouTube channel to learn step-by-step video tutorials
👉 YouTube.com/@PKAnExcelExpert


Reviews
There are no reviews yet.