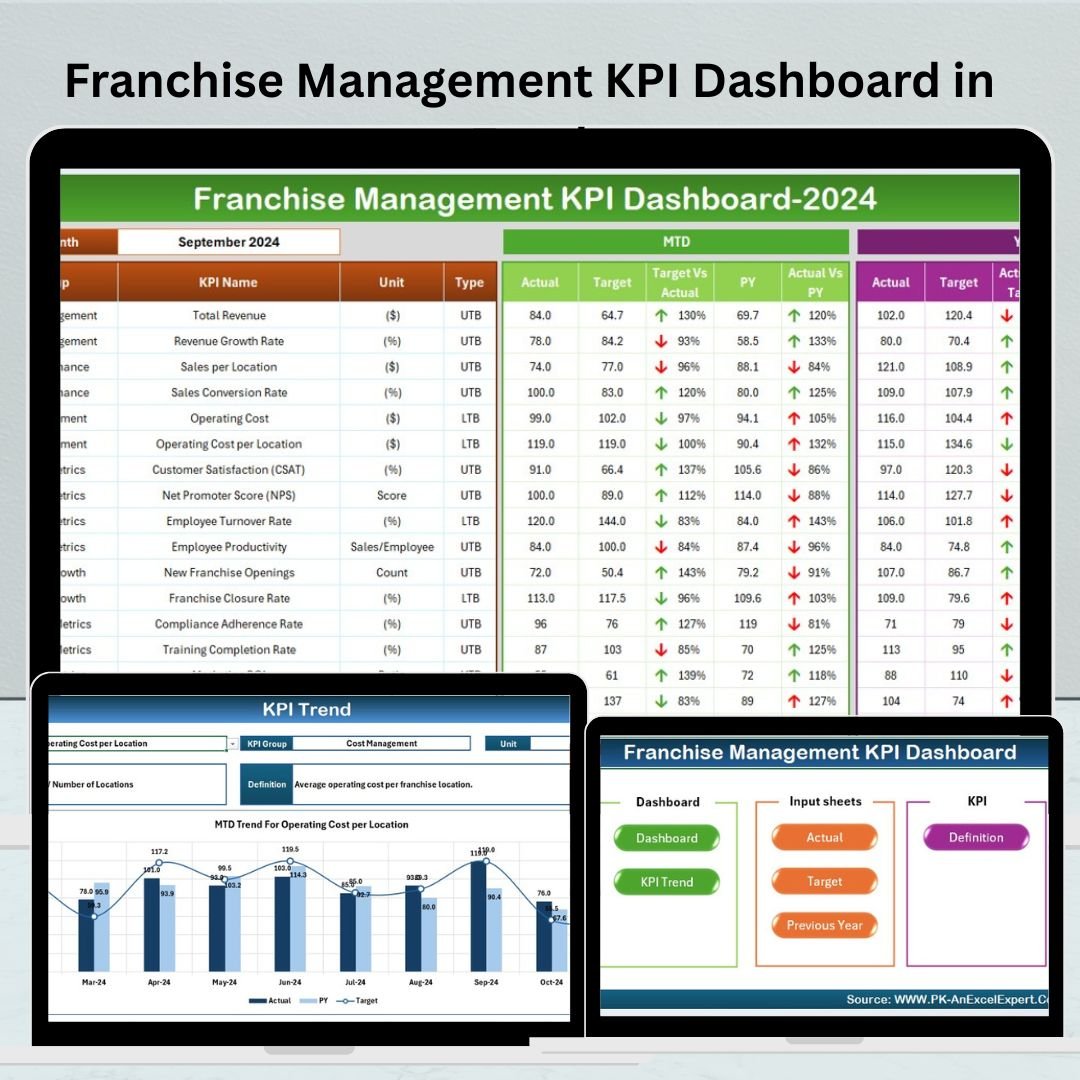
The Franchise Management KPI Dashboard in Excel is a powerful and intuitive tool designed to help franchise owners, managers, and stakeholders track and optimize their franchise performance. This Excel-based dashboard provides valuable insights into key performance indicators (KPIs) such as revenue growth, franchisee performance, customer satisfaction, and operational efficiency, enabling you to make informed decisions to drive business success.
Whether you manage a single franchise location or a network of multiple franchises, this dashboard offers a centralized platform to monitor critical business metrics, assess franchisee performance, and ensure overall operational consistency. It helps franchise operators keep track of essential performance indicators, identify areas of improvement, and scale their businesses effectively.
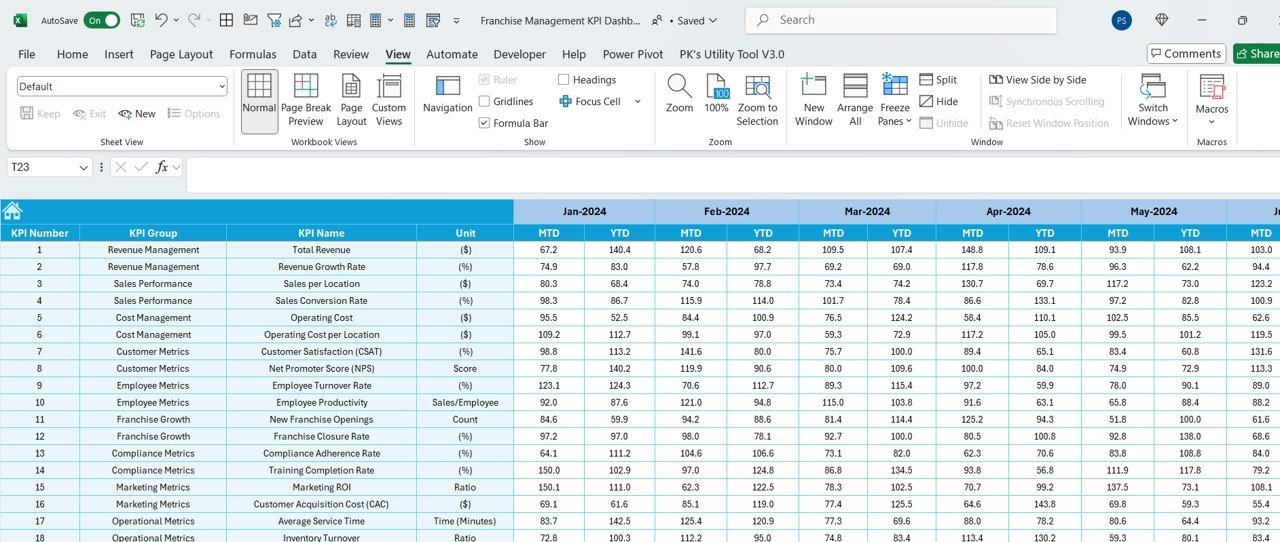
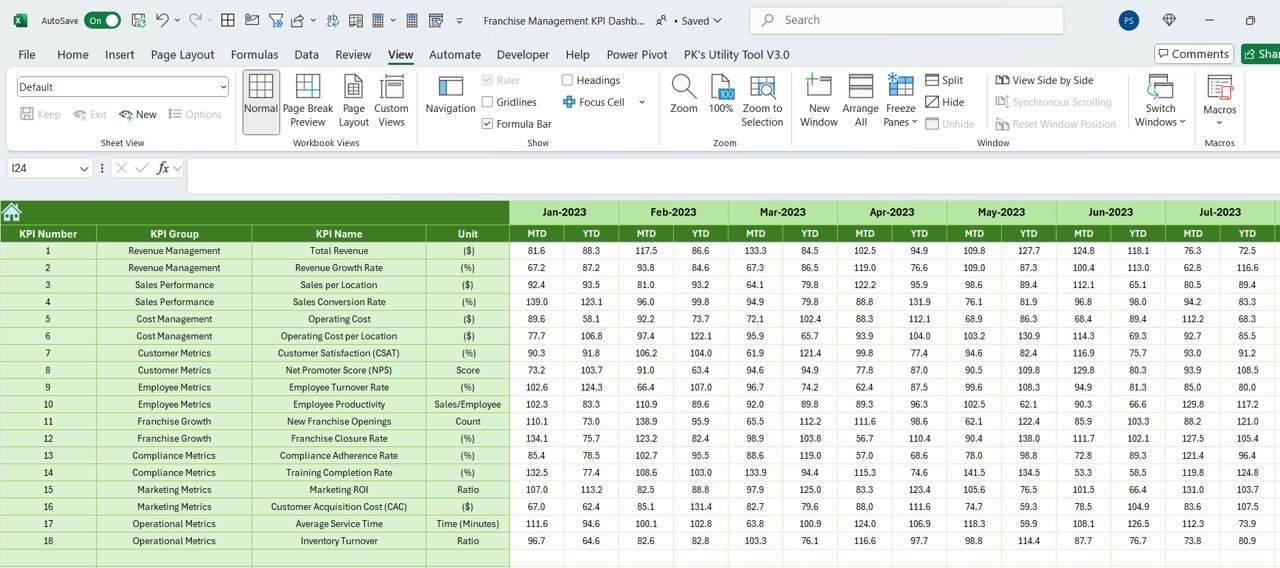
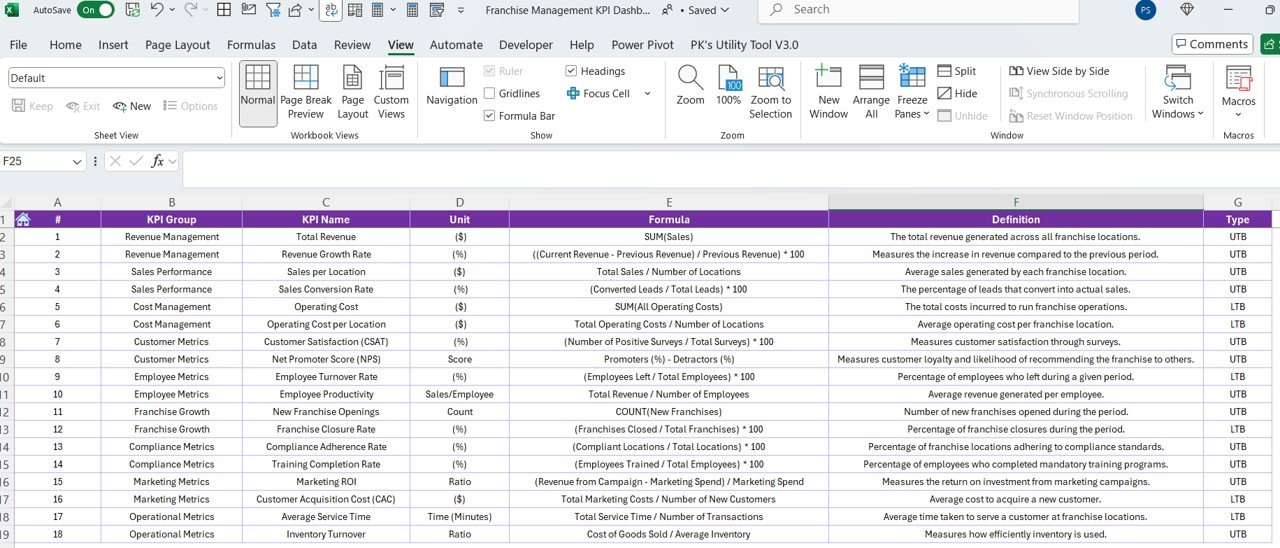
Key Features of the Franchise Management KPI Dashboard in Excel
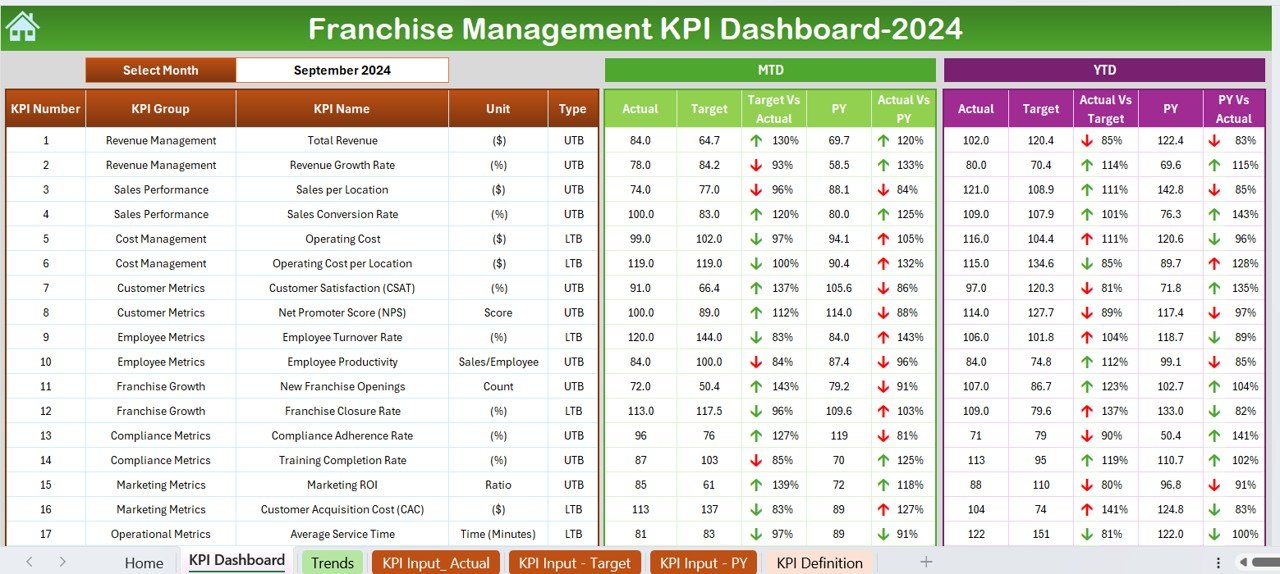
📊 Comprehensive KPI Tracking
Track a variety of franchise performance metrics such as sales, revenue, customer satisfaction, employee performance, and marketing efforts. Get a complete view of your franchise’s health in one place.
💼 Franchisee Performance Monitoring
Monitor the performance of individual franchisees by tracking their sales, compliance, and operational metrics. This helps you identify high-performing franchisees and areas where improvement is needed.
📈 Sales & Revenue Insights
Track sales and revenue across different time periods, locations, and franchisees. This allows you to identify sales trends, seasonal fluctuations, and potential opportunities for growth.
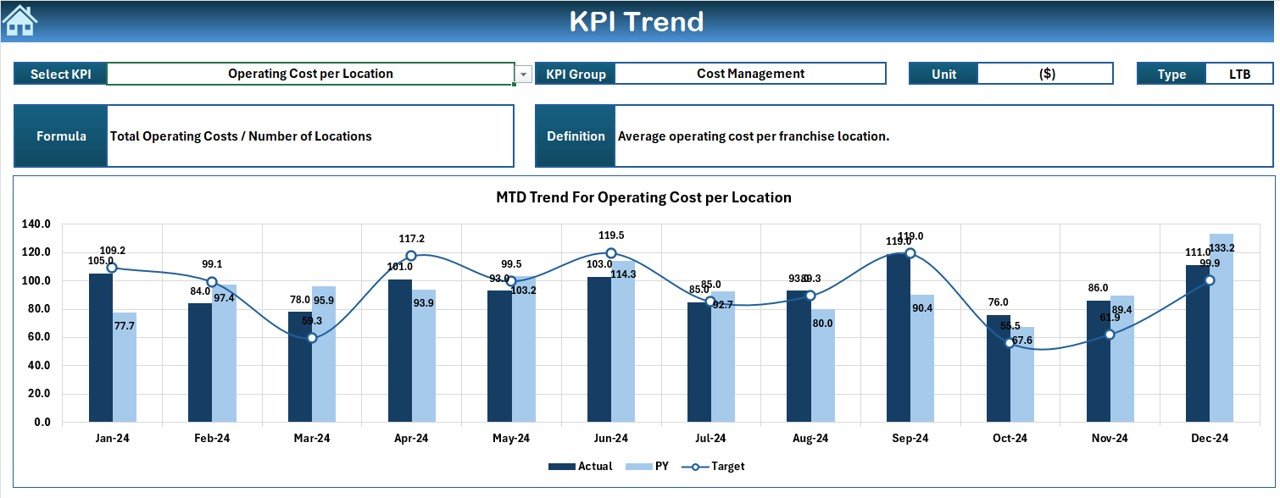
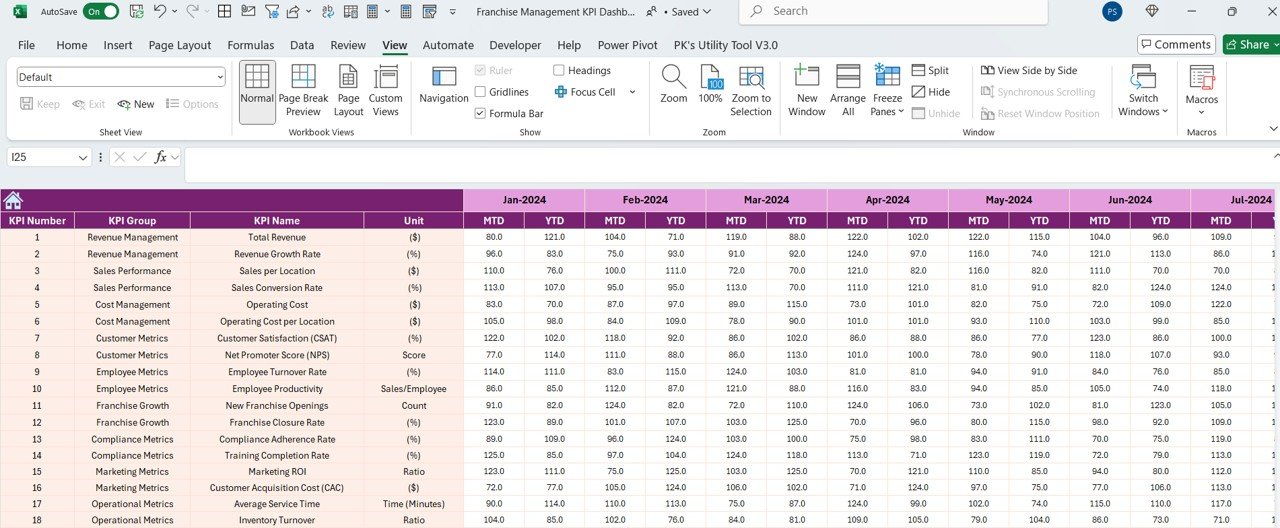
📅 Time-Based Analysis
Analyze performance data over different time periods—monthly, quarterly, and yearly. This feature allows you to track the progress of your franchise network and make timely adjustments.
📉 Cost Efficiency & Profitability Tracking
Track operating costs, profit margins, and overall profitability of individual franchises. Use this data to identify inefficiencies and take actions to improve your bottom line.
⚙️ Customizable & Scalable Dashboard
Tailor the dashboard to your specific franchise needs. Add custom KPIs, adjust performance tracking, and modify data inputs to suit the goals and objectives of your franchise operation.
Why You’ll Love the Franchise Management KPI Dashboard in Excel

✅ Centralized Franchise Performance Tracking
Monitor and evaluate the performance of all your franchise locations from one dashboard. Track sales, operational efficiency, and franchisee compliance at a glance.
✅ Make Data-Driven Decisions
Use the insights provided by the dashboard to make informed decisions that improve operational efficiency, increase profitability, and enhance customer satisfaction.
✅ Identify Areas for Improvement
Pinpoint franchise locations that require attention based on performance data. Identify underperforming areas and implement strategies for improvement.
✅ Streamline Reporting & Performance Reviews
Generate easy-to-understand reports for franchise performance reviews. Streamline franchisee communication and ensure you are aligned with company objectives.
✅ Scalable & Flexible
The dashboard is adaptable to suit both single-location franchises and large franchise networks. It’s scalable to accommodate growth and customizations as your business expands.
What’s Inside the Franchise Management KPI Dashboard in Excel?
-
Comprehensive KPI Tracking: Monitor franchise performance, sales, and customer satisfaction.
-
Franchisee Performance Monitoring: Track individual franchisee performance and operational metrics.
-
Sales & Revenue Tracking: Analyze sales, revenue trends, and performance over time.
-
Cost Efficiency & Profitability Metrics: Monitor costs, profit margins, and overall profitability.
-
Time-Based Performance Analysis: Track progress over monthly, quarterly, or yearly periods.
-
Customizable Dashboard: Tailor the dashboard to fit your franchise operation’s unique needs.
How to Use the Franchise Management KPI Dashboard in Excel
1️⃣ Download the Template: Instantly access the Franchise Management KPI Dashboard in Excel.
2️⃣ Input Franchise Data: Add your franchise sales, revenue, and operational data to the dashboard.
3️⃣ Track Franchisee Performance: Monitor franchisee metrics to evaluate performance and compliance.
4️⃣ Analyze Sales & Revenue Trends: Track performance over time and identify opportunities for growth.
5️⃣ Optimize Profitability: Monitor costs and profitability to improve your franchise operation’s financial performance.
Who Can Benefit from the Franchise Management KPI Dashboard in Excel?
🔹 Franchise Owners & Operators
🔹 Franchise Managers & Supervisors
🔹 Multi-Unit Franchise Owners
🔹 Business Development & Franchise Expansion Teams
🔹 Financial Analysts & Operations Managers
🔹 Franchise Marketing & Sales Teams
🔹 Investors & Stakeholders in Franchise Businesses
Ensure your franchise operations run smoothly and efficiently with the Franchise Management KPI Dashboard in Excel. Track performance, optimize processes, and scale your business with this powerful tool.
Click here to read the Detailed blog post
Visit our YouTube channel to learn step-by-step video tutorials
Youtube.com/@PKAnExcelExpert


Reviews
There are no reviews yet.