In today’s global financial ecosystem, foreign exchange (Forex) services play a vital role in international trade, remittances, travel transactions, investments, and digital payments. Banks, forex brokers, remittance companies, and financial institutions process thousands of currency transactions daily. However, managing forex operations using scattered spreadsheets and manual reports often leads to delays, reporting errors, and limited operational visibility.
The Forex Services Dashboard in Excel is a powerful, ready-to-use analytical solution designed to transform complex forex transaction data into clear, actionable insights. Built entirely in Microsoft Excel, this dashboard allows organizations to monitor transaction performance, customer activity, settlement efficiency, service fees, and regional currency conversions through interactive visual analytics.
Instead of analyzing multiple reports manually, users can track all forex performance indicators from a centralized dashboard. Consequently, managers quickly identify operational trends, improve service efficiency, and make faster data-driven decisions.
This dashboard leverages Excel’s advanced features such as Pivot Tables, slicers, automated calculations, and dynamic charts. Because Excel is widely accessible and familiar to most professionals, organizations can implement this solution without expensive software investments or technical complexity.
The dashboard is structured using multiple analytical pages connected through a user-friendly Page Navigator, enabling seamless navigation between insights. Each page focuses on a specific operational dimension, helping users move from high-level summaries to deep performance analysis effortlessly.
Whether managing currency exchanges, remittance services, or international payment operations, this dashboard provides complete visibility into forex performance. As a result, organizations enhance transparency, reduce processing delays, and optimize operational strategies.
📊 Key Feature of Forex Services Dashboard in Excel
💱 Centralized Forex Performance Monitoring
Track all transactions, fees, and conversions in one dashboard.
📈 Interactive KPI Cards
Instantly evaluate operational performance and efficiency.
🔎 Dynamic Slicers & Filters
Analyze data by customer type, branch, region, or channel.
⏱ Settlement Time Tracking
Monitor processing speed and identify delays quickly.
💰 Service Fee Analysis
Understand revenue contribution by customers and channels.
🌍 Regional Conversion Insights
Analyze transaction distribution geographically.
📅 Monthly Trend Monitoring
Track growth patterns and seasonal transaction behavior.
⚡ Automatic Updates
Dashboard visuals refresh instantly after data updates.
📦 What’s Inside the Forex Services Dashboard in Excel
The Excel file includes five structured analytical pages along with supporting sheets.
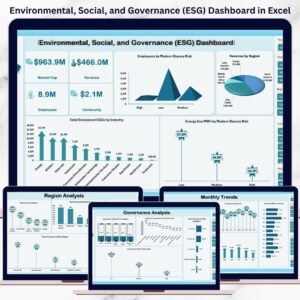
🔹 1. Overview Page – Complete Forex Business Snapshot
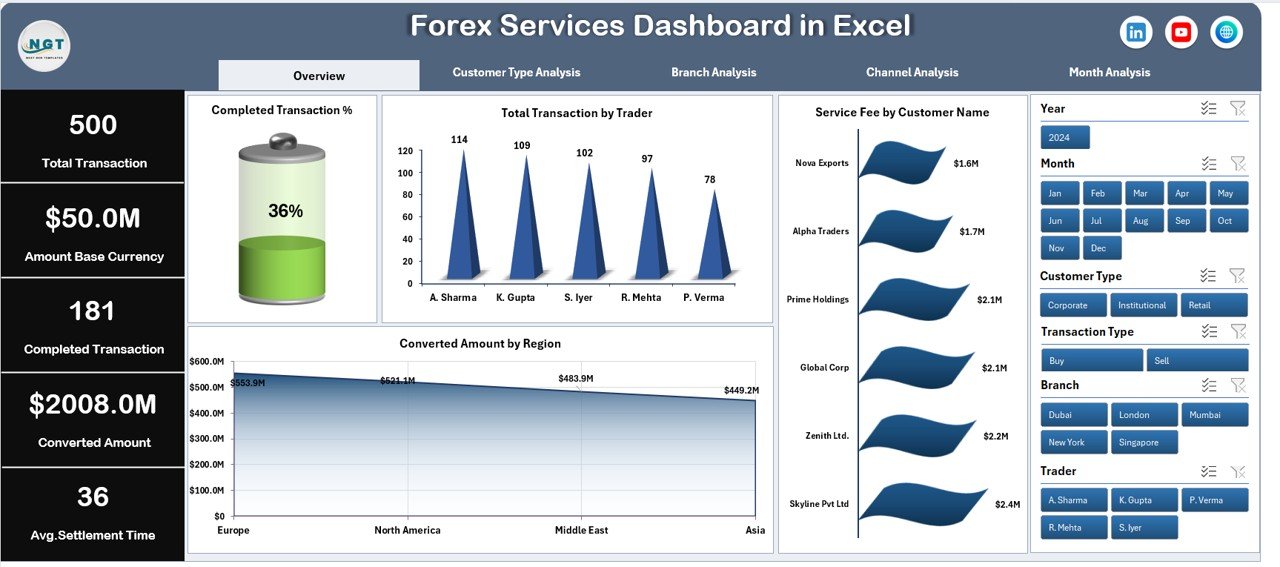
The Overview page acts as the main control center.
Key Elements
-
Right-side slicers for filtering
-
Four KPI cards
-
Interactive performance charts
Charts Included
-
Completed Transaction %
-
Total Transaction by Trader
-
Service Fee by Customer Name
-
Converted Amount by Region
Managers instantly understand overall operational performance.
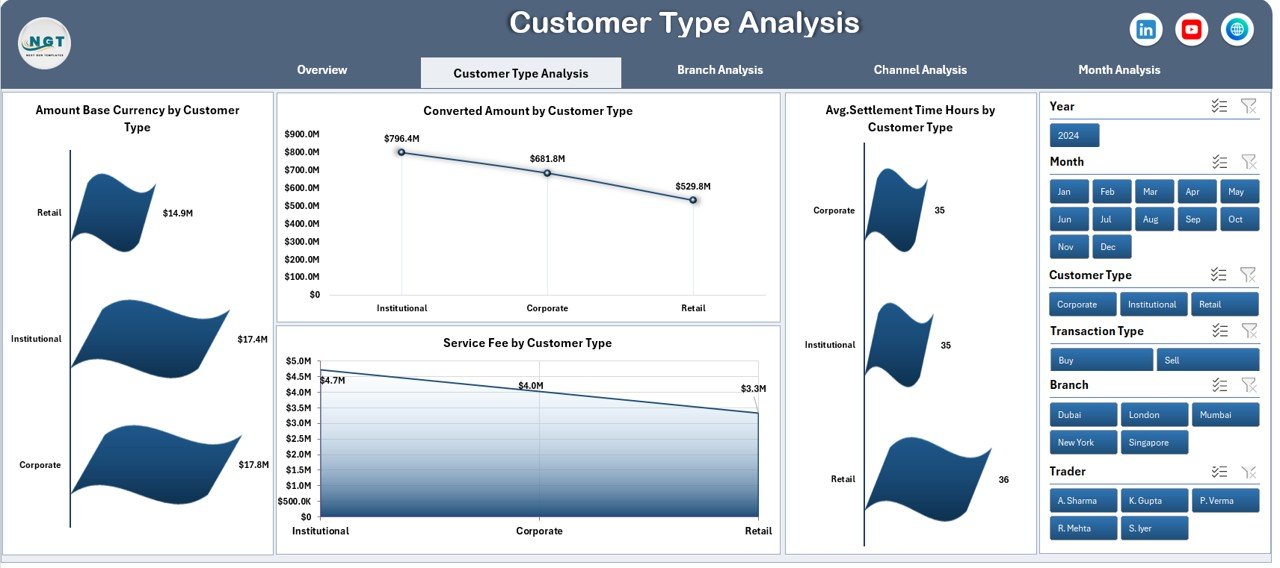
🔹 2. Customer Type Analysis – Customer Behavior Insights
Analyzes forex performance across customer segments.
Charts Included
-
Amount Base Currency by Customer Type
-
Converted Amount by Customer Type
-
Avg. Settlement Time (Hours) by Customer Type
-
Service Fee by Customer Type
Helps identify profitable customer groups and service efficiency.
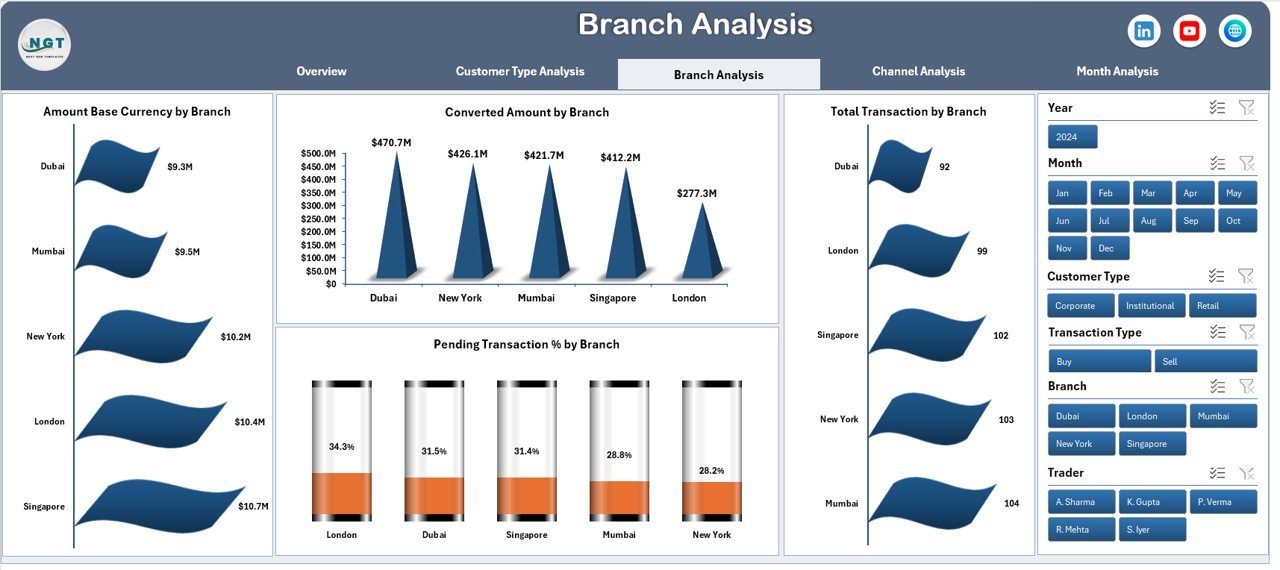
🔹 3. Branch Analysis – Operational Performance by Branch
Compares branch-level performance.
Charts Included
-
Amount Base Currency by Branch
-
Converted Amount by Branch
-
Total Transactions by Branch
-
Pending Transaction % by Branch
Supports performance monitoring and operational accountability.
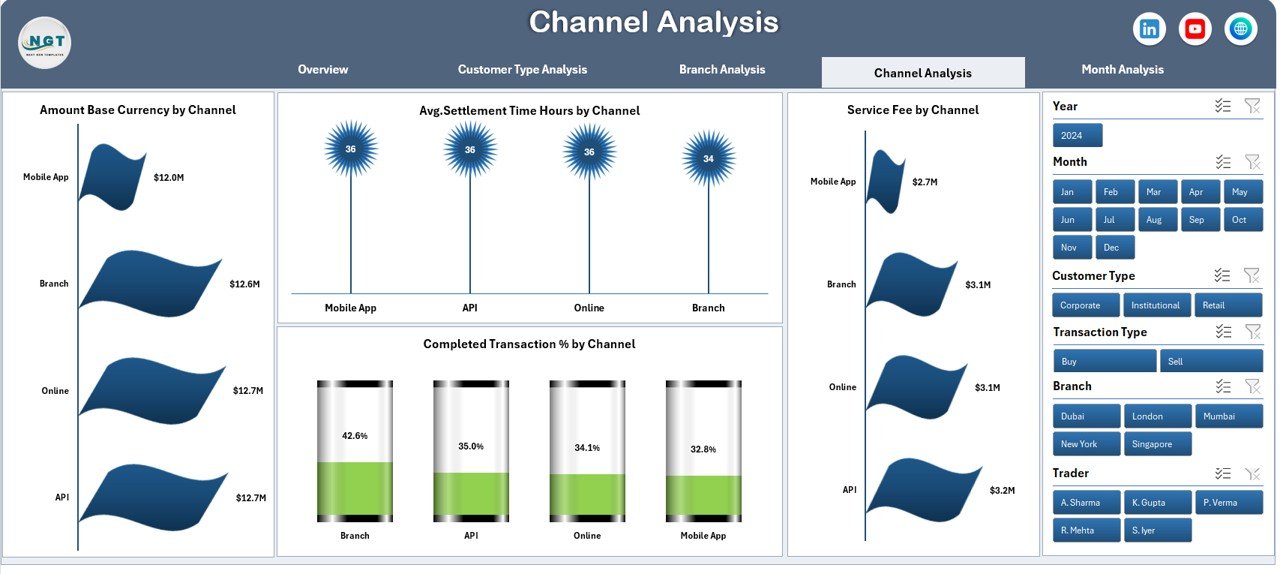
🔹 4. Channel Analysis – Service Channel Performance
Evaluates how customers interact with forex services.
Charts Included
-
Amount Base Currency by Channel
-
Avg. Settlement Time by Channel
-
Service Fee by Channel
-
Completed Transaction % by Channel
Helps optimize service channels and improve customer experience.
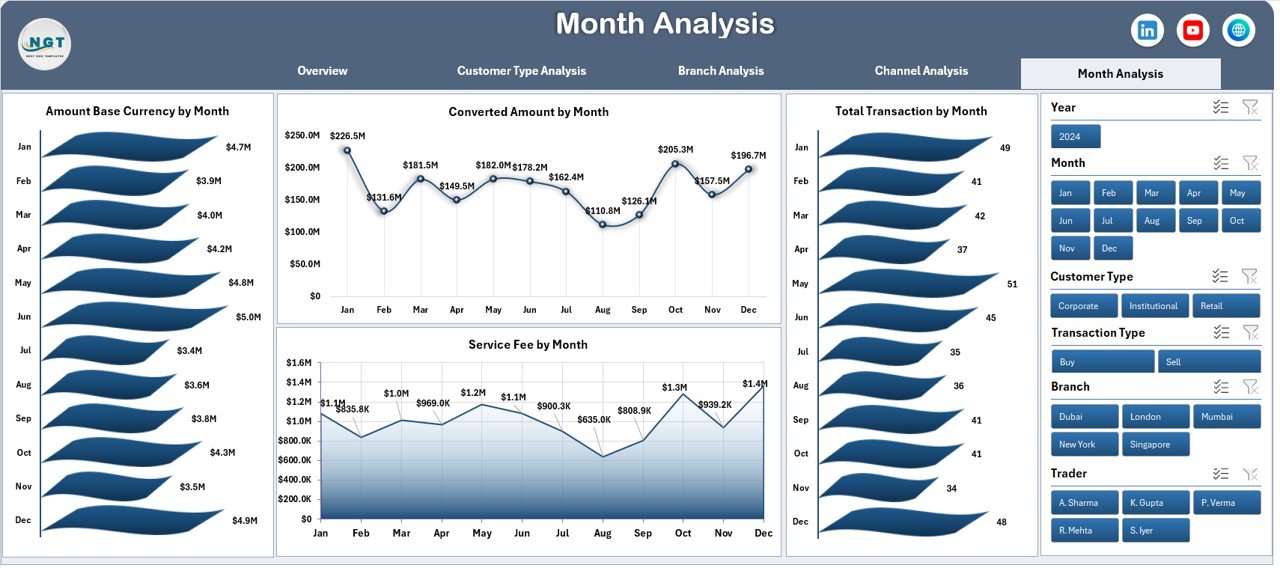
🔹 5. Month Analysis – Time-Based Performance Trends
Tracks forex performance over time.
Charts Included
-
Amount Base Currency by Month
-
Converted Amount by Month
-
Total Transactions by Month
-
Service Fee by Month
Enables forecasting and financial planning.
⚙️ How to Use the Forex Services Dashboard in Excel
1️⃣ Enter transaction data into the Data Sheet.
2️⃣ Refresh Pivot Tables if required.
3️⃣ Use slicers for filtering analysis.
4️⃣ Navigate pages using the Page Navigator.
5️⃣ Review KPIs and charts for insights.
No advanced Excel skills are required.
👥 Who Can Benefit from This Forex Dashboard
Ideal for:
✔ Forex Service Providers
✔ Banks & Financial Institutions
✔ Currency Exchange Companies
✔ Remittance Businesses
✔ International Payment Providers
✔ Financial Analysts
✔ Operations Managers
🚀 How to Use the Forex Services Dashboard Strategically
Organizations can use this dashboard to:
✅ Monitor transaction efficiency in real time
✅ Identify high-value customers
✅ Reduce pending settlements
✅ Improve operational transparency
✅ Optimize service channels
✅ Enhance decision-making speed
Ultimately, businesses move from manual reporting to intelligent forex analytics.
### Click here to read the Detailed blog post
Visit our YouTube channel to learn step-by-step video tutorials
👉 https://youtube.com/@PKAnExcelExpert