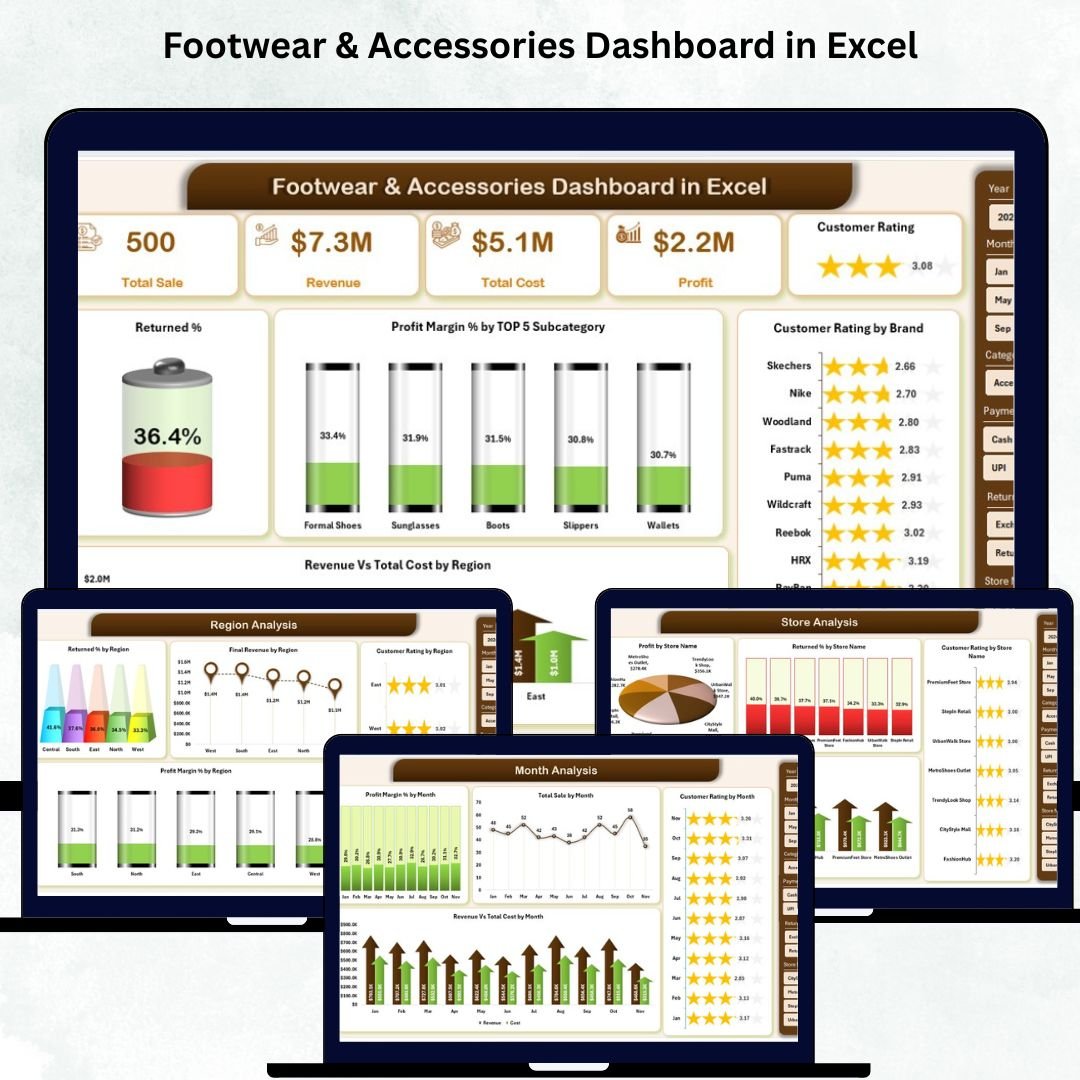
Managing a fast-moving retail business becomes easier when you can see all your numbers in one place. The Footwear & Accessories Dashboard in Excel is a powerful, ready-to-use analytics system designed for footwear brands, fashion retailers, accessory stores, and multi-brand chains. Whether you sell shoes, handbags, belts, wallets, or other accessories, this dashboard helps you track sales, understand returns, measure profitability, and analyze customer ratings with complete clarity.
Built with user-friendly Excel formulas, slicers, conditional formatting, and dynamic visuals, this dashboard gives you instant insights—without complex software or technical skills. Simply paste your raw data into the Data Sheet, and the entire dashboard updates automatically. It saves hours of manual work every week and helps you make faster, smarter decisions.
🔥 Key Features of the Footwear & Accessories Dashboard in Excel
This dashboard is packed with smart analytics tools to help you understand your business better:
⭐ Ready-to-Use Interactive Dashboard
View KPIs such as Total Sales, Total Cost, Final Revenue, Profit Margin %, and Returned % instantly.
⭐ Page Navigator
A sleek left-side navigation panel lets you switch between pages without scrolling.
⭐ Slicers on Every Page
Filter data by brand, region, store, subcategory, month, and year for deep analysis.
⭐ Clean Visual Layout
Charts, KPIs, and tables are neatly organized for smooth performance review.
⭐ Automatic Updates
Paste your data into the Data Sheet → refresh → get instant insights.
📦 What’s Inside the Footwear & Accessories Dashboard
This Excel template includes five powerful analytical pages, each designed to provide a complete 360° view of your retail business:
1️⃣ Overview Page
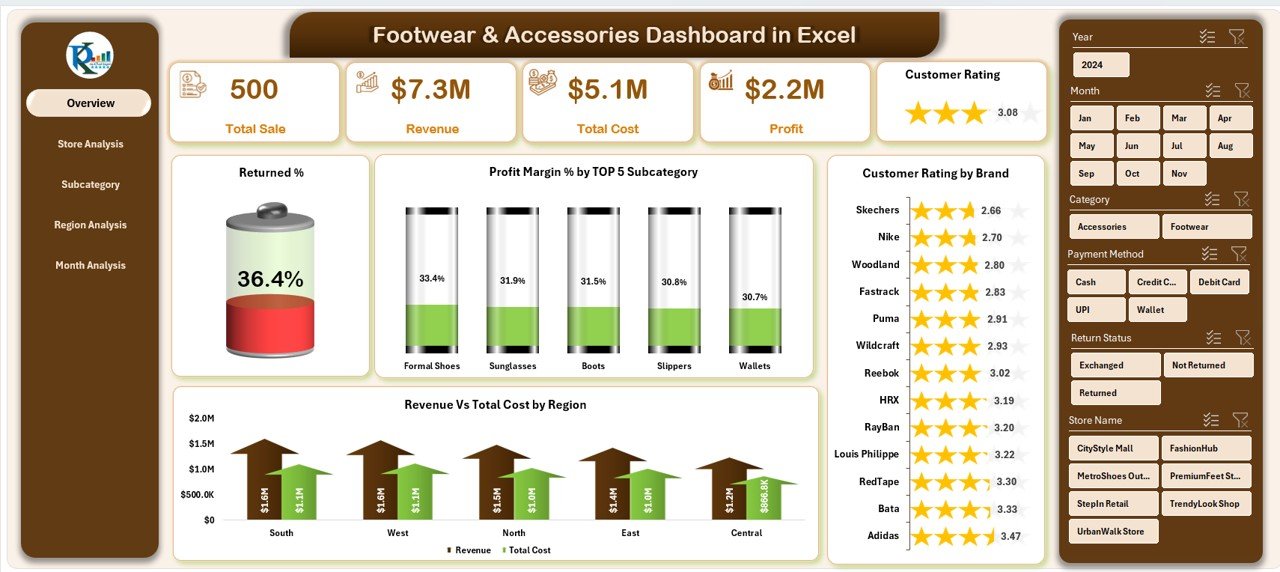
Shows a full business snapshot with charts for:
✔ Customer Rating by Brand
✔ Returned %
✔ Profit Margin % by Top 5 Subcategories
✔ Revenue vs Total Cost by Region
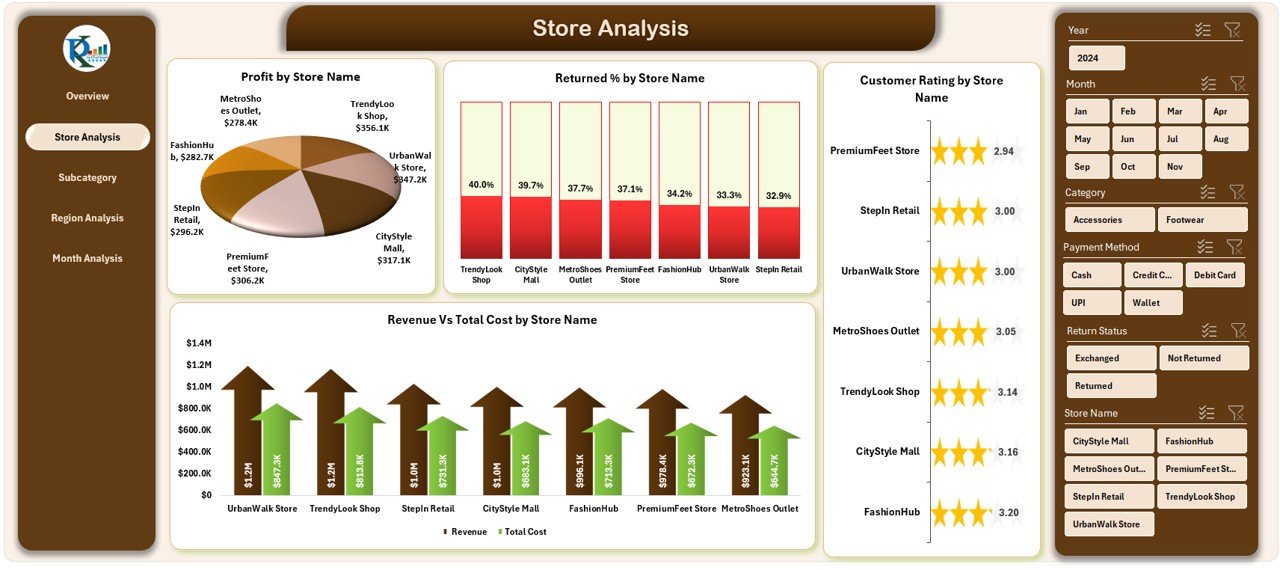
2️⃣ Store Analysis Page
Analyze store-level performance with:
✔ Profit by Store
✔ Customer Rating by Store
✔ Returned % by Store
✔ Revenue vs Cost by Store
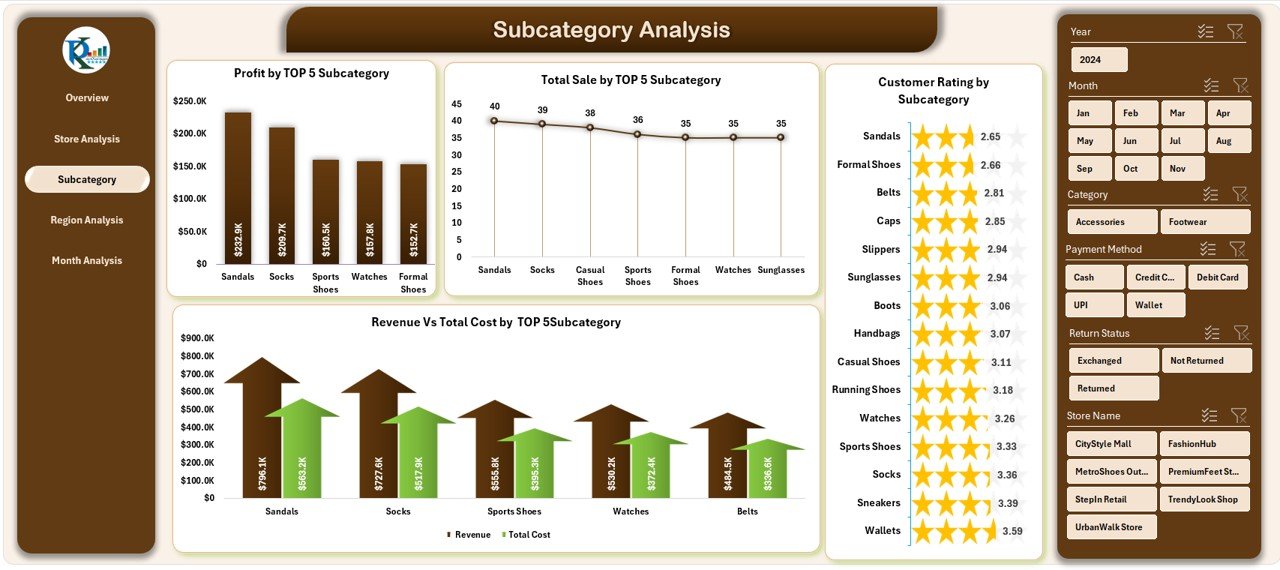
3️⃣ Subcategory Analysis Page
Study product-level behavior through:
✔ Profit by Top Subcategories
✔ Sales by Subcategory
✔ Customer Rating by Subcategory
✔ Revenue vs Cost by Subcategory
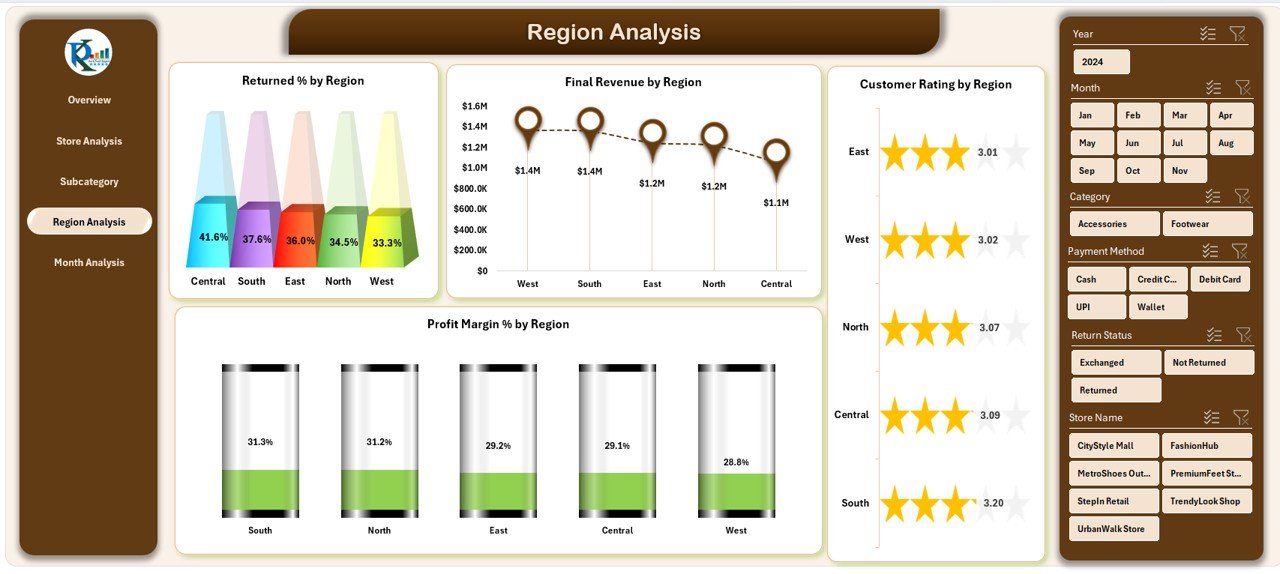
4️⃣ Region Analysis Page
Compare market performance across regions with:
✔ Returned % by Region
✔ Revenue by Region
✔ Profit Margin % by Region
✔ Customer Rating by Region
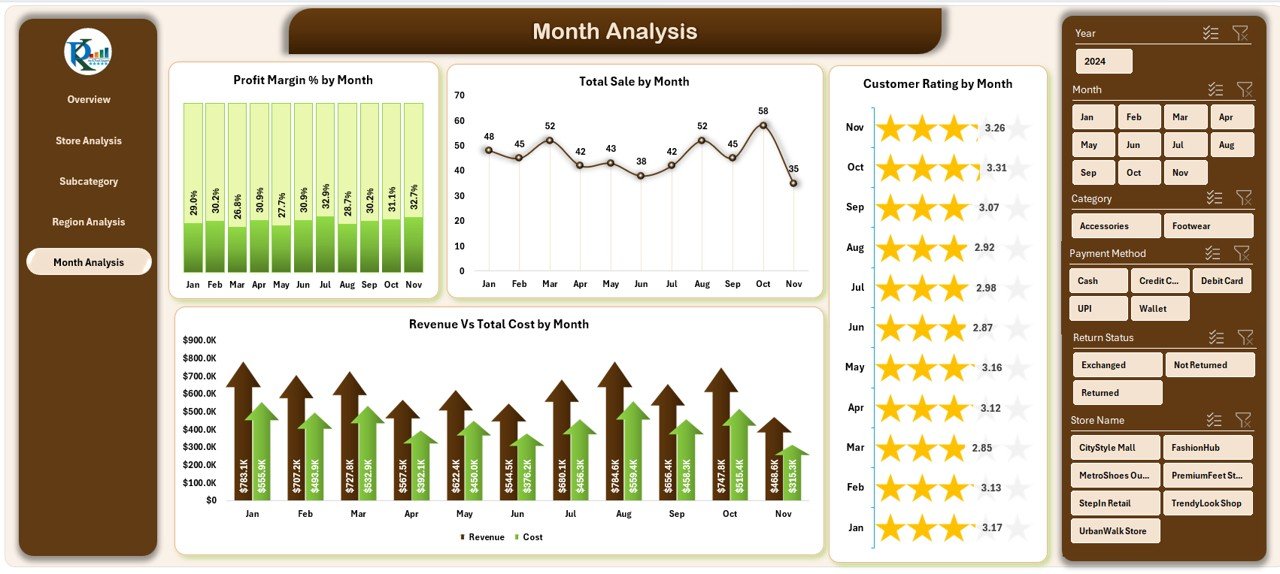
5️⃣ Month Analysis Page
Understand seasonal trends and business cycles using:
✔ Sales by Month
✔ Profit Margin % by Month
✔ Customer Rating by Month
✔ Revenue vs Cost by Month
🛠️ How to Use the Footwear & Accessories Dashboard in Excel
Using this dashboard is extremely simple—even for beginners:
Step 1:
Enter or paste your raw data (sales, cost, returns, ratings, etc.) into the Data Sheet.
Step 2:
Refresh the dashboard once.
Step 3:
Use slicers to filter by brand, month, store, or category.
Step 4:
Review KPIs, identify weak areas, and take action.
Step 5:
Use monthly insights for forecasting, budgeting, and strategic planning.
This dashboard requires no VBA, macros, or coding skills.
👥 Who Can Benefit from This Dashboard
This Excel dashboard is designed for anyone involved in retail decision-making:
✔ Footwear Retailers
✔ Accessory Stores & Boutiques
✔ Store Managers & Branch Heads
✔ Category Managers
✔ Retail Planners & Analysts
✔ Multi-Brand Outlets
✔ Franchise Owners
✔ Fashion Retail Startups
Whether you manage a single store or multiple branches, this tool helps you monitor performance with confidence.
### 🔗 Click Here to Read the Detailed Blog Post
📺 Visit our YouTube channel to learn step-by-step video tutorials
👉 https://www.youtube.com/@PKAnExcelExpert


Reviews
There are no reviews yet.