The Flooring and Tiles KPI Dashboard changes rapidly. Design trends evolve. Builders demand bulk orders with tight deadlines. Raw material costs fluctuate constantly. Therefore, manufacturers, distributors, and retail showrooms must monitor performance with precision.
If you still depend on scattered spreadsheets, you are missing growth opportunities.
Now imagine tracking Sales Growth, Profit Margin %, Production Efficiency, Inventory Turnover, MTD vs Target, YTD Performance, and Previous Year Comparison — all inside one interactive Power BI dashboard.
That is exactly what the Flooring and Tiles KPI Dashboard in Power BI delivers.
This ready-to-use dashboard connects directly to Excel data and transforms your numbers into powerful visuals, KPI indicators, and performance comparisons. As a result, you gain full control over your business decisions.
Stop guessing. Start measuring what matters.
🚀 Key Features of Flooring and Tiles KPI Dashboard in Power BI
📊 3 Interactive Dashboard Pages
📅 MTD & YTD Performance Tracking
🎯 Target vs Actual Comparison
📈 Current Year vs Previous Year Growth Analysis
🔼 Visual Performance Icons (Green ▲ / Red ▼)
🔎 Month & KPI Group Slicers
📉 Combo Trend Charts
🧩 Drill-Through KPI Definitions
📂 Excel-Based Data Source Integration
Built in Power BI, this dashboard offers dynamic filtering, instant refresh, and clear performance insights for smarter decision-making.
📦 What’s Inside the Flooring and Tiles KPI Dashboard in Power BI
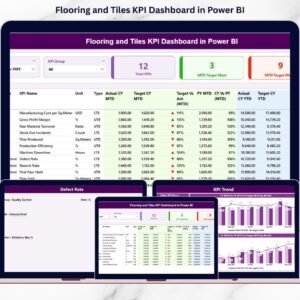
This dashboard includes 3 structured and interactive pages designed for clarity and control:
1️⃣ Summary Page – Main Control Panel
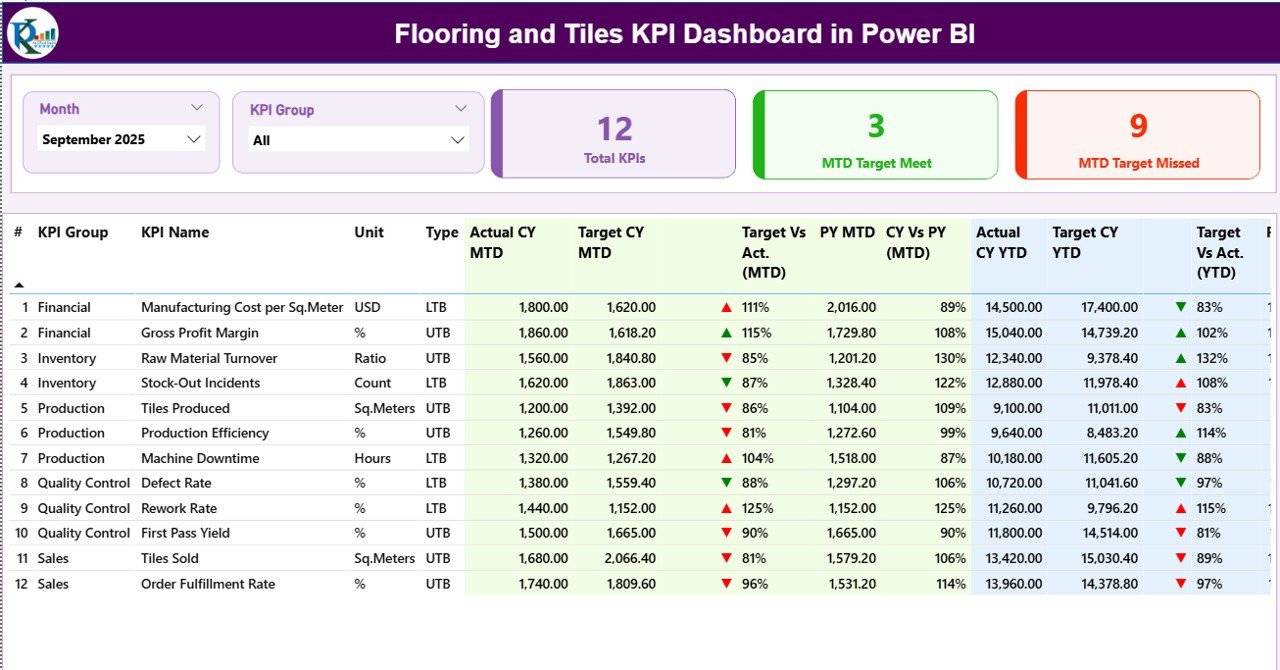
This page provides a complete performance snapshot.
At the top, you get:
-
Month Slicer
-
KPI Group Slicer
Instantly filter KPIs by:
-
Sales
-
Production
-
Finance
-
Inventory
-
Quality
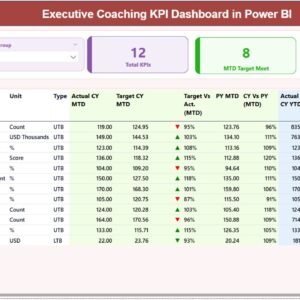
Performance Cards show:
-
Total KPIs Count
-
MTD Target Meet Count
-
MTD Target Missed Count
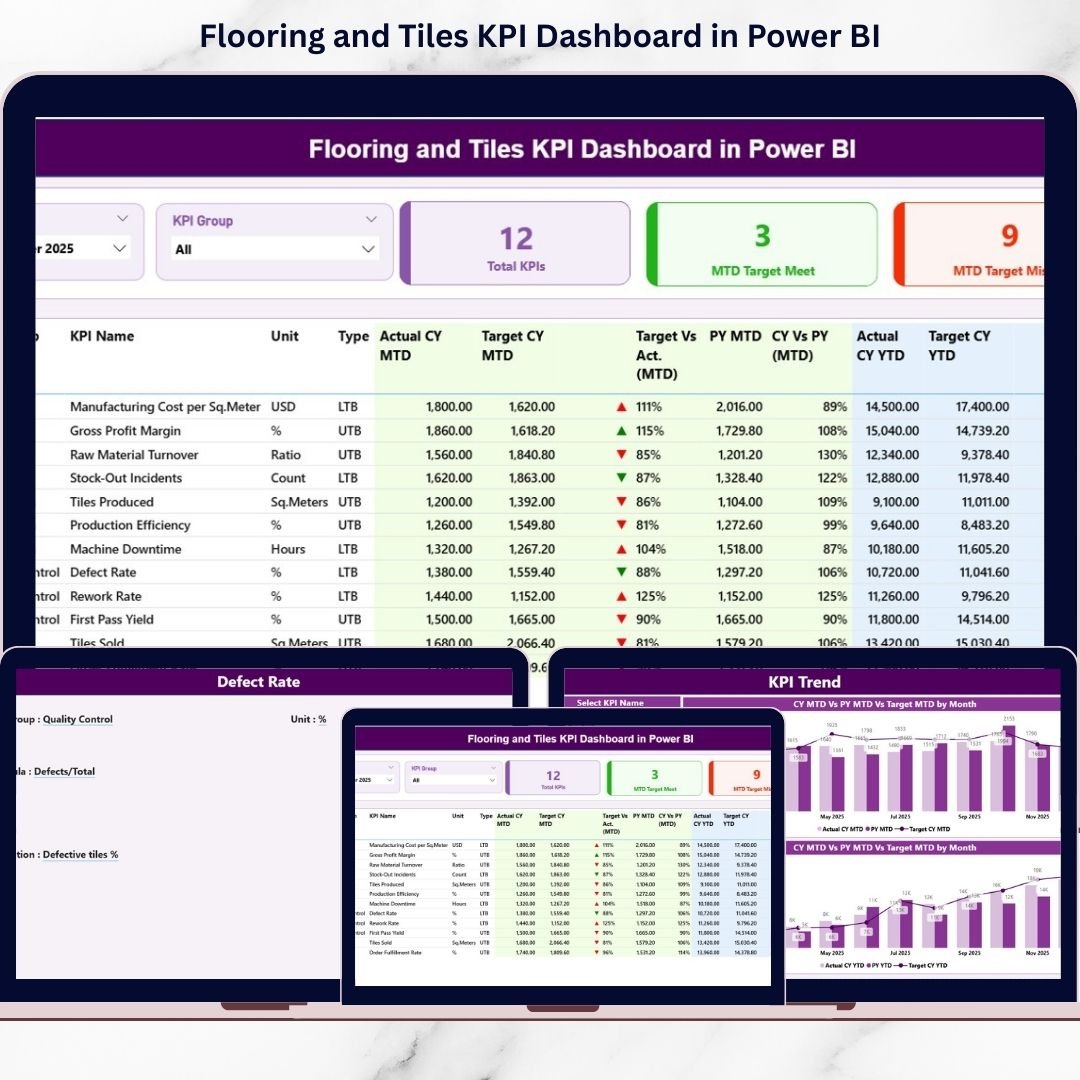
Below that, a detailed KPI table displays:
✔ KPI Number
✔ KPI Group
✔ KPI Name
✔ Unit
✔ Type (UTB or LTB)
✔ MTD Actual, Target & Previous Year
✔ YTD Actual, Target & Previous Year
✔ Achievement % & Growth %
Conditional icons instantly highlight performance direction.
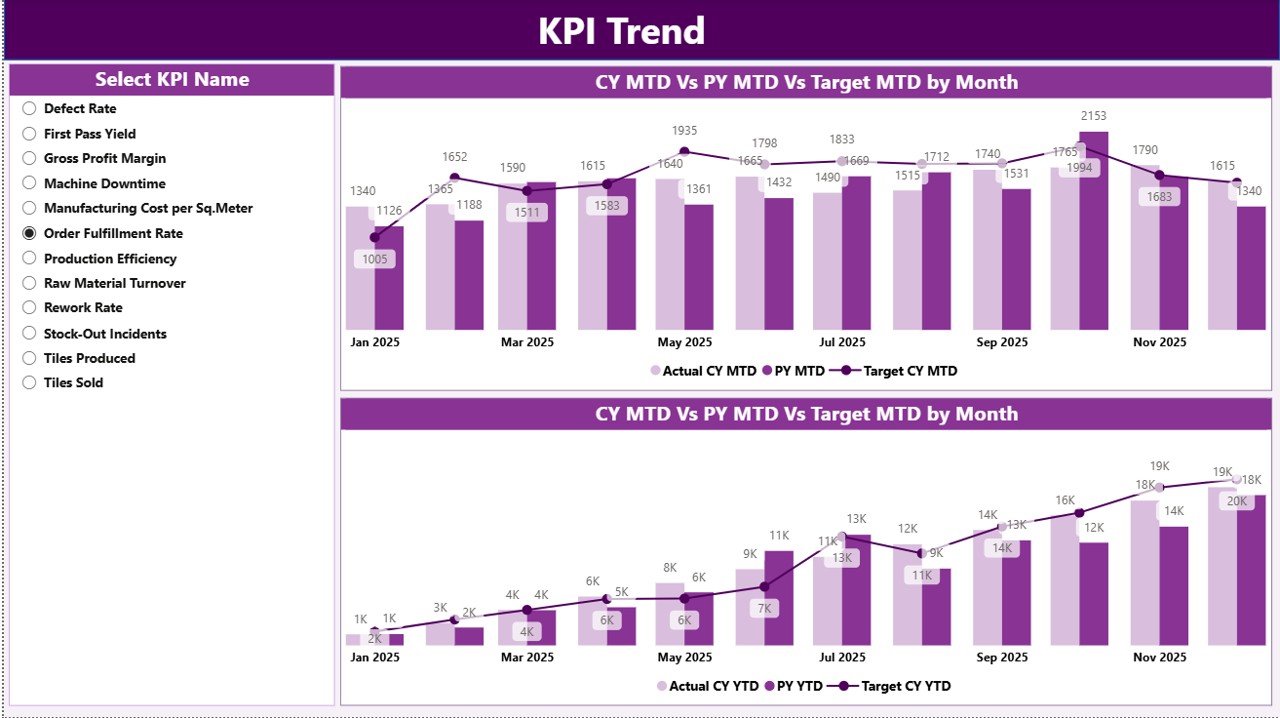
2️⃣ KPI Trend Page – Growth & Performance Trends
This page displays two powerful combo charts:
📊 MTD Trend Chart
📊 YTD Trend Chart
Each chart compares:
-
Current Year Actual
-
Previous Year Actual
-
Target Values
Using the KPI Name slicer, you can analyze trends for any KPI instantly.
Detect seasonal slowdowns. Identify consistent growth. Spot declining performance early.
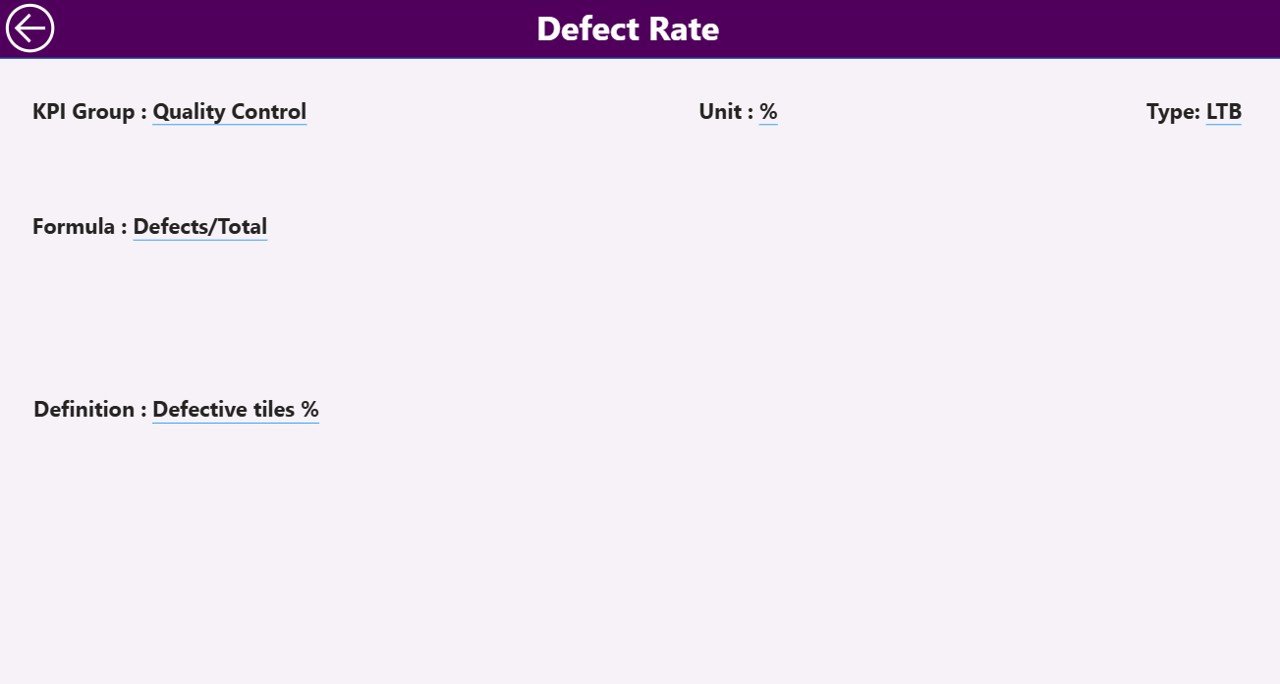
3️⃣ KPI Definition Page – Detailed KPI Information
This page works as a drill-through page.
From the Summary Page:
Right-click → Drill Through → View KPI Definition
You can view:
-
KPI Number
-
KPI Group
-
Unit
-
Formula
-
Definition
-
KPI Type (UTB or LTB)
This ensures clarity and transparency across teams.
🛠 How to Use the Flooring and Tiles KPI Dashboard in Power BI
Using this dashboard is simple:
1️⃣ Enter Actual data in Excel (Input_Actual sheet)
2️⃣ Enter Target values (Input_Target sheet)
3️⃣ Maintain KPI structure (KPI Definition sheet)
4️⃣ Refresh Power BI
5️⃣ Use slicers to analyze performance
No advanced Power BI skills required. The structure is ready — you only update data.
👥 Who Can Benefit from This Flooring and Tiles KPI Dashboard in Power BI
🏭 Tile Manufacturers
🏬 Ceramic & Vitrified Tile Dealers
🏗 Construction Material Distributors
🏪 Retail Tile Showrooms
📊 Sales Managers
💰 Finance Teams
📦 Inventory Managers
Whether you manage a small showroom or a large production unit, this dashboard supports structured performance tracking.
By using this dashboard, you:
✔ Monitor sales growth accurately
✔ Track production efficiency
✔ Improve inventory control
✔ Compare targets with actual performance
✔ Analyze historical growth
✔ Identify underperforming KPIs instantly
✔ Increase profitability systematically
This is not just a report. It is a complete KPI performance management system built for the flooring and tiles industry.
If you want better visibility, faster decisions, and stronger growth — this dashboard delivers exactly that.