


Fitness apps are growing faster than ever. Every day, users track workouts, calories, steps, heart rate, and progress through mobile apps. At the same time, app owners and product managers must monitor downloads, active users, retention, engagement, and revenue. Fitness Apps KPI Dashboard in Excel However, when this data stays scattered across analytics tools and reports, teams lose clarity and speed.
That is exactly why the Fitness Apps KPI Dashboard in Excel becomes a powerful, practical, and cost-effective performance tracking solution.
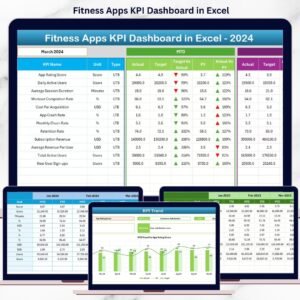
Fitness Apps KPI Dashboard in Excel This ready-to-use Excel dashboard converts complex app data into clear KPIs, trends, and performance indicators. Instead of switching between tools or building reports manually, you get one centralized dashboard that shows MTD and YTD performance, target achievement, and year-over-year growth.
Whether you manage a fitness startup, wellness platform, subscription app, or digital health product, this dashboard helps you scale faster, retain users better, and monetize smarter—using data, not assumptions.
🚀 Key Features of Fitness Apps KPI Dashboard in Excel
📊 All App KPIs in One Dashboard
Track acquisition, engagement, retention, and revenue together.
📅 MTD & YTD Performance Tracking
Monitor short-term results and long-term growth in one view.
🎯 Target vs Actual Comparison
Identify growth gaps and missed goals instantly.
📈 KPI Trend Analysis
Spot performance patterns, spikes, and drop-offs early.
🚦 Visual Performance Indicators
Green ▲ and Red ▼ arrows show status at a glance.
⚙️ 100% Excel-Based Template
No coding, no BI tools—simple and flexible.
🧠 Clear KPI Definitions
Everyone understands what each metric means.
📂 What’s Inside the Fitness Apps KPI Dashboard in Excel
🏠 Home Sheet – Easy Navigation
The Home Sheet acts as the dashboard’s navigation hub.

🔘 Highlights
-
Clean and professional layout
-
Six navigation buttons
-
One-click access to all worksheets
As a result, users move through the dashboard smoothly and confidently.
📊 Dashboard Sheet – Complete Performance Overview
The Dashboard Sheet is the main analytical page.
📅 Month Selection
Select the reporting month from cell D3, and the entire dashboard updates automatically.
📈 KPIs Displayed
Both MTD (Month-to-Date) and YTD (Year-to-Date) metrics are shown.
MTD Metrics
-
Actual
-
Target
-
Previous Year
-
Target vs Actual (%)
-
Previous Year vs Actual (%)
YTD Metrics
-
Actual
-
Target
-
Previous Year
-
Target vs Actual (%)
-
Previous Year vs Actual (%)
🚦 Visual Indicators
-
Green ▲ = Positive performance
-
Red ▼ = Performance gap
Therefore, issues become visible instantly without manual analysis.
📈 KPI Trend Sheet – Deep Performance Insights
The KPI Trend Sheet helps you analyze individual KPIs in detail.
🎯 KPI Selection
Select a KPI from the drop-down in cell C3.
📋 KPI Details
-
KPI Group
-
Unit
-
KPI Type (UTB / LTB)
-
Formula
-
Definition
📊 Trend Charts
-
MTD Trend – Actual vs Target vs Previous Year
-
YTD Trend – Actual vs Target vs Previous Year
These visuals reveal growth, decline, and stability patterns clearly.
📝 Supporting Input Sheets
📌 Actual Numbers Input Sheet – Enter real app performance data
🎯 Target Sheet – Define monthly and yearly goals
📆 Previous Year Sheet – Enable year-over-year comparison
📘 KPI Definition Sheet – Maintain KPI logic and clarity
This structure ensures accuracy, transparency, and scalability.
👥 Who Can Benefit from This Dashboard
🏃 Fitness app founders
📱 Product managers
📈 Growth & marketing teams
📊 Business analysts
🚀 Startup owners
🧑💼 Consultants
🔎 Click here to read the Detailed blog post
📺 Visit our YouTube channel to learn step-by-step video tutorials
👉 https://youtube.com/@PKAnExcelExpert


Reviews
There are no reviews yet.