


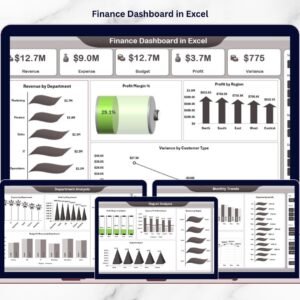
Managing financial data should not feel complicated, time-consuming, or risky. Yet many businesses still struggle with scattered spreadsheets, manual calculations, and delayed financial insights. That is exactly why the Finance and Accounting Dashboard in Excel is designed—to turn complex financial data into clear, actionable, and decision-ready insights within minutes.
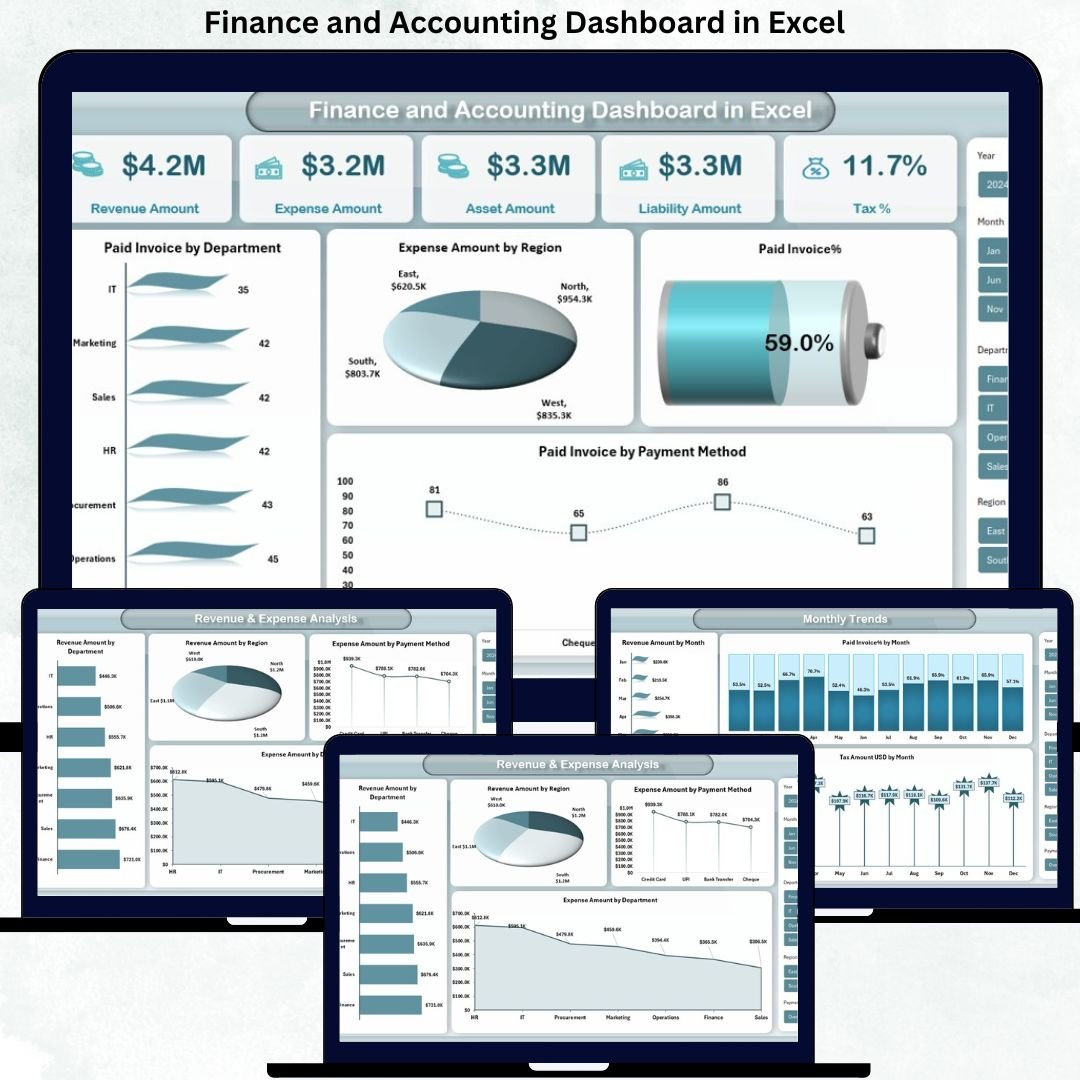
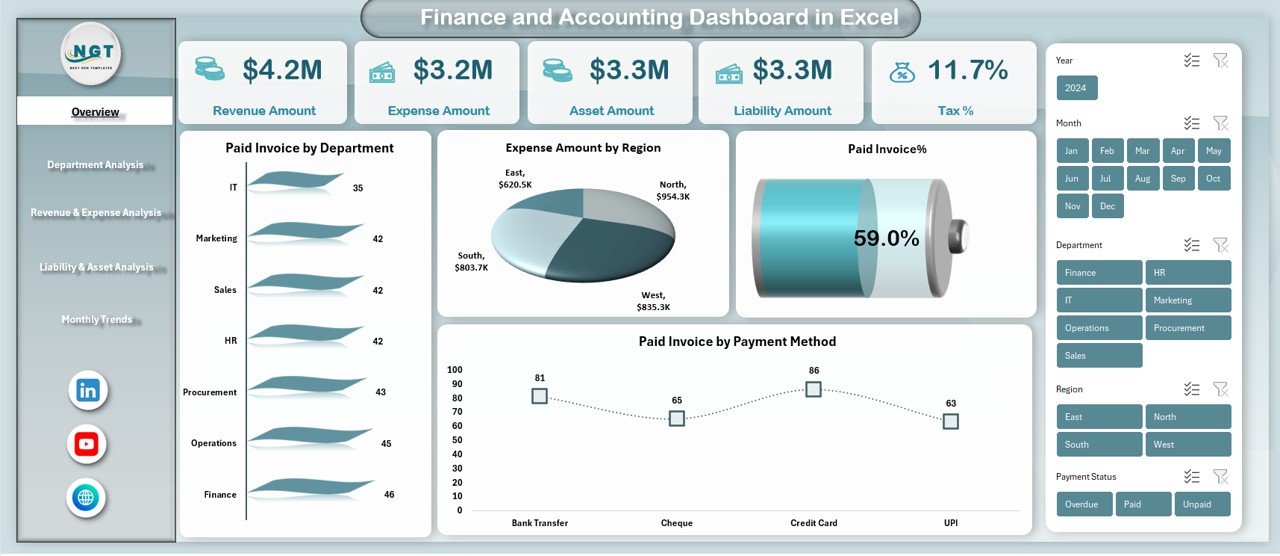
This ready-to-use Excel dashboard acts as a central command center for your finance and accounting operations. Instead of switching between multiple reports, you get real-time visibility into revenue, expenses, assets, liabilities, taxes, invoices, and monthly trends—all in one powerful Excel file.
Whether you manage daily accounting operations or make high-level financial decisions, this dashboard helps you save time, reduce errors, and stay in full control of your finances.
🚀 Key Features of Finance and Accounting Dashboard in Excel
This dashboard is thoughtfully designed to deliver maximum clarity with minimum effort.
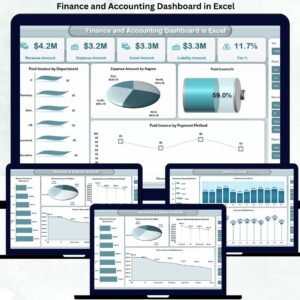
It provides centralized financial visibility, allowing you to track revenue, expenses, assets, liabilities, taxes, and invoices from a single screen.
You can monitor department-wise, region-wise, and payment-method-wise performance, ensuring deeper financial insights.
The dashboard includes dynamic charts, KPIs, and summaries that update automatically when data changes.
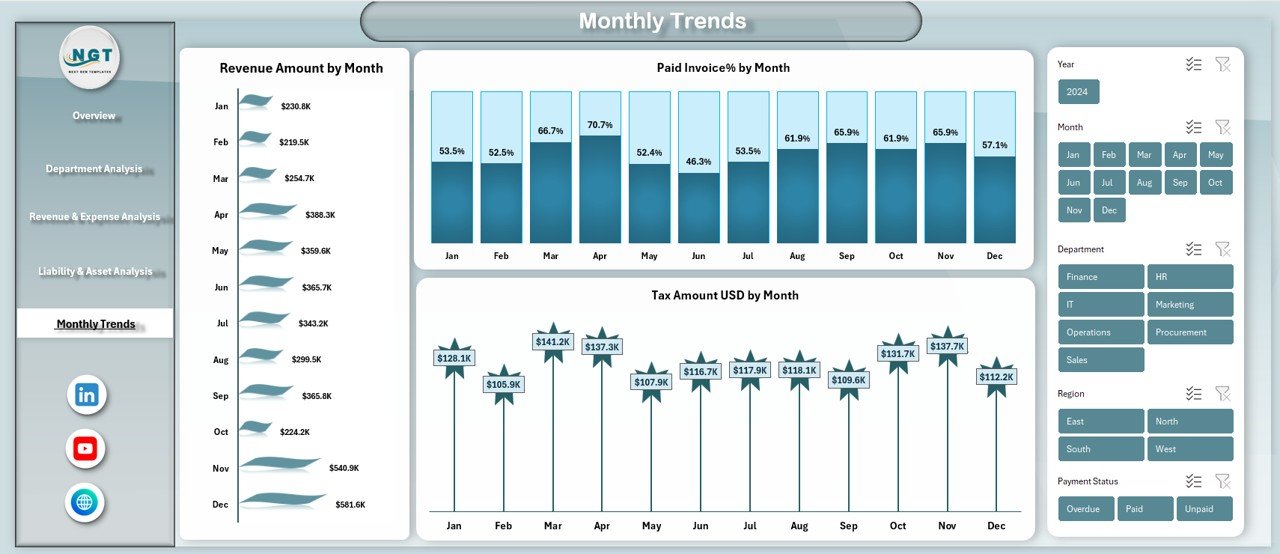
With monthly trend analysis, you can easily identify growth patterns, risks, and seasonal behavior.
Because it runs entirely in Excel, it stays cost-effective, flexible, and easy to customize—without relying on expensive BI tools.
📦 What’s Inside the Finance and Accounting Dashboard in Excel
This digital product includes multiple structured and professionally designed worksheet tabs:
-
Overview Sheet – A high-level snapshot of financial health, including revenue, expenses, assets, liabilities, tax %, and invoice status.
-
Department Analysis Sheet – Tracks unpaid invoices, overdue invoices, tax amounts, and overdue percentages by department.
-
Revenue & Expense Analysis Sheet – Deep insights into income and cost distribution across departments, regions, and payment methods.
-
Liability & Asset Analysis Sheet – Focuses on balance sheet elements for better financial planning and control.
-
Monthly Trends Sheet – Visualizes revenue growth, paid invoice %, and tax trends month-by-month.
Each sheet is designed to answer real business questions, not just show numbers.
🛠️ How to Use the Finance and Accounting Dashboard in Excel
Using this dashboard is simple and intuitive.
First, enter or paste your financial data into the predefined input areas.
Next, Excel formulas and pivot tables process the data automatically.
The dashboard instantly updates charts, KPIs, and summaries without manual effort.
You can filter data by department, region, payment method, or month to analyze performance from different perspectives.
As a result, you spend less time preparing reports and more time analyzing and deciding.
🎯 Who Can Benefit from This Finance and Accounting Dashboard in Excel
This dashboard is ideal for a wide range of professionals:
-
Finance Managers and Controllers who need quick financial insights
-
Accounting Teams handling invoices, taxes, and expenses
-
CFOs and Business Owners making strategic financial decisions
-
Auditors and Consultants reviewing financial performance
-
Small and Medium Business Owners seeking clarity without complexity
If you use Excel for finance, this dashboard fits perfectly into your workflow.
Click here to read the Detailed Blog Post
Watch the step-by-step video tutorial:
Visit our YouTube channel to learn step-by-step video tutorials and see this dashboard in action.


Reviews
There are no reviews yet.