Running a successful fashion boutique today requires more than intuition and spreadsheets scattered across folders. You must monitor sales performance, inventory efficiency, profitability, and trends—all at the same time. That is exactly why the Fashion Boutiques KPI Dashboard in Excel is designed as a powerful, ready-to-use performance tracking solution for modern fashion retailers.
This dashboard transforms raw boutique data into clear KPIs, visual indicators, and actionable insights—without complicated BI tools or technical skills. Built entirely in Excel, it delivers instant clarity, better control, and confident decision-making for boutique owners and managers.
Instead of wasting hours preparing reports, you get a single, structured Excel dashboard that updates automatically and highlights exactly what matters most to your business.
🚀 Key Features of Fashion Boutiques KPI Dashboard in Excel
✨ Centralized KPI Monitoring
Track all critical fashion boutique KPIs from one clean and well-structured Excel dashboard.
📅 MTD & YTD Performance Tracking
Monitor Month-to-Date and Year-to-Date Actual, Target, and Previous Year performance effortlessly.
🎯 Target vs Actual Analysis
Instantly identify target-met and target-missed KPIs using intuitive up-and-down arrow indicators.
📊 Dynamic Month Selection
Select any month from the drop-down and watch the entire dashboard update automatically.
📈 Trend Analysis by KPI
Analyze individual KPI performance using dedicated MTD and YTD trend charts.
🧭 User-Friendly Navigation
A dedicated Summary (Index) page with navigation buttons makes the dashboard easy for anyone to use.
💰 Cost-Effective Excel Solution
No subscriptions, no complex tools—just powerful analytics in Excel.
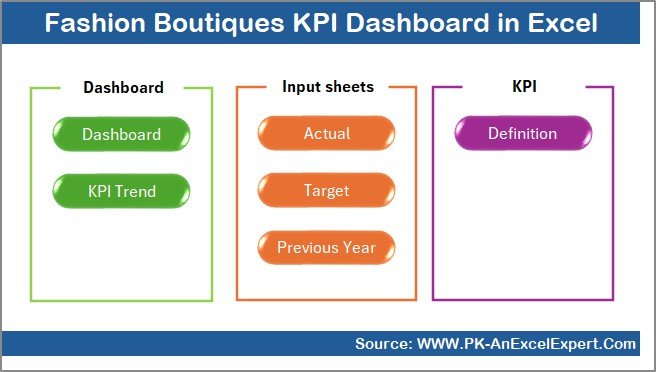
📂 What’s Inside the Fashion Boutiques KPI Dashboard in Excel
📌 Summary Page (Index Sheet)
Acts as a navigation hub with buttons to access all dashboard worksheets instantly.
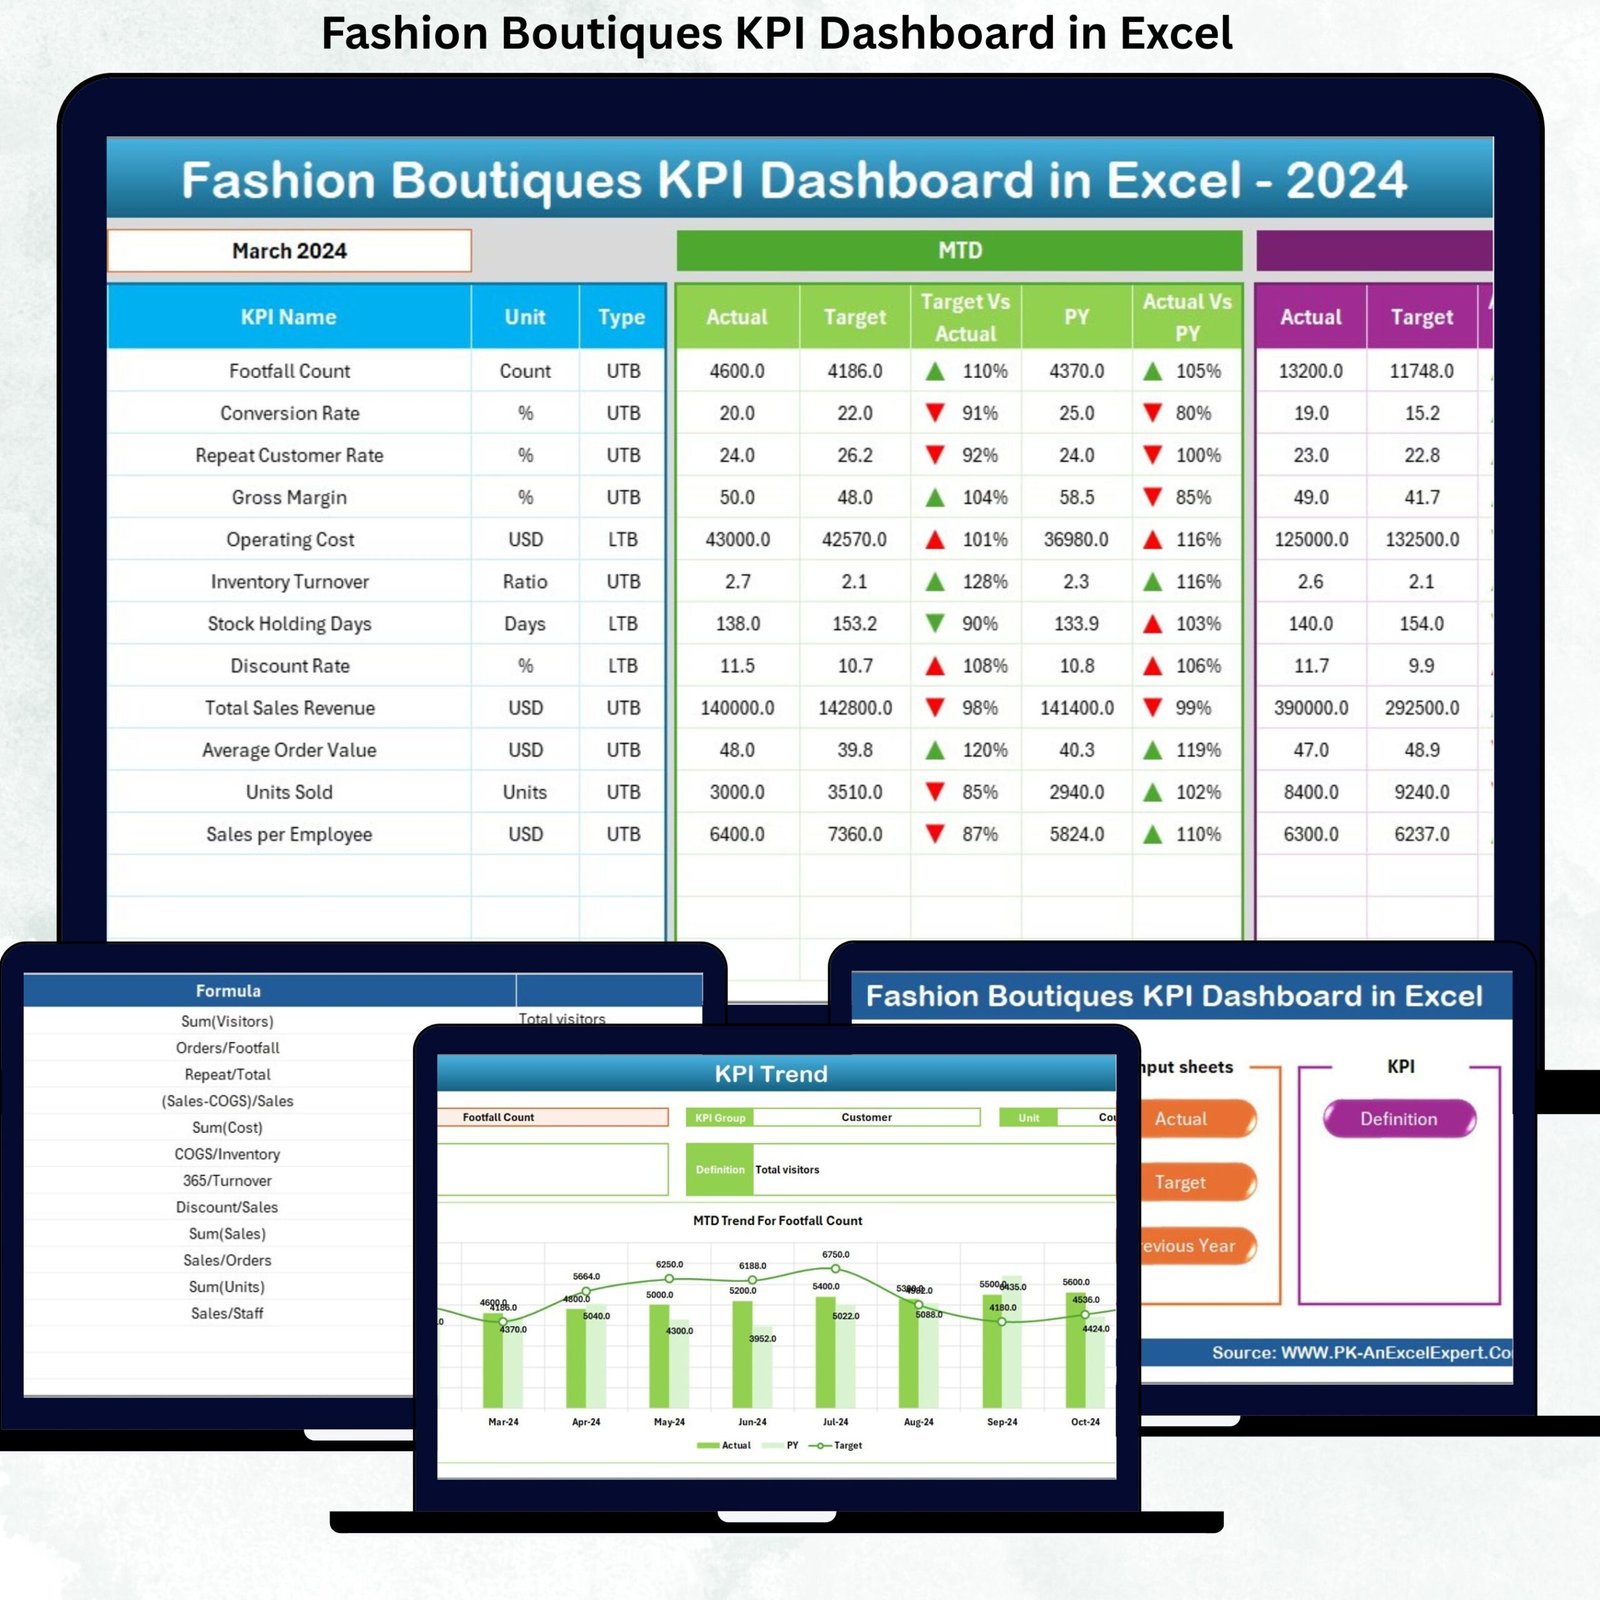
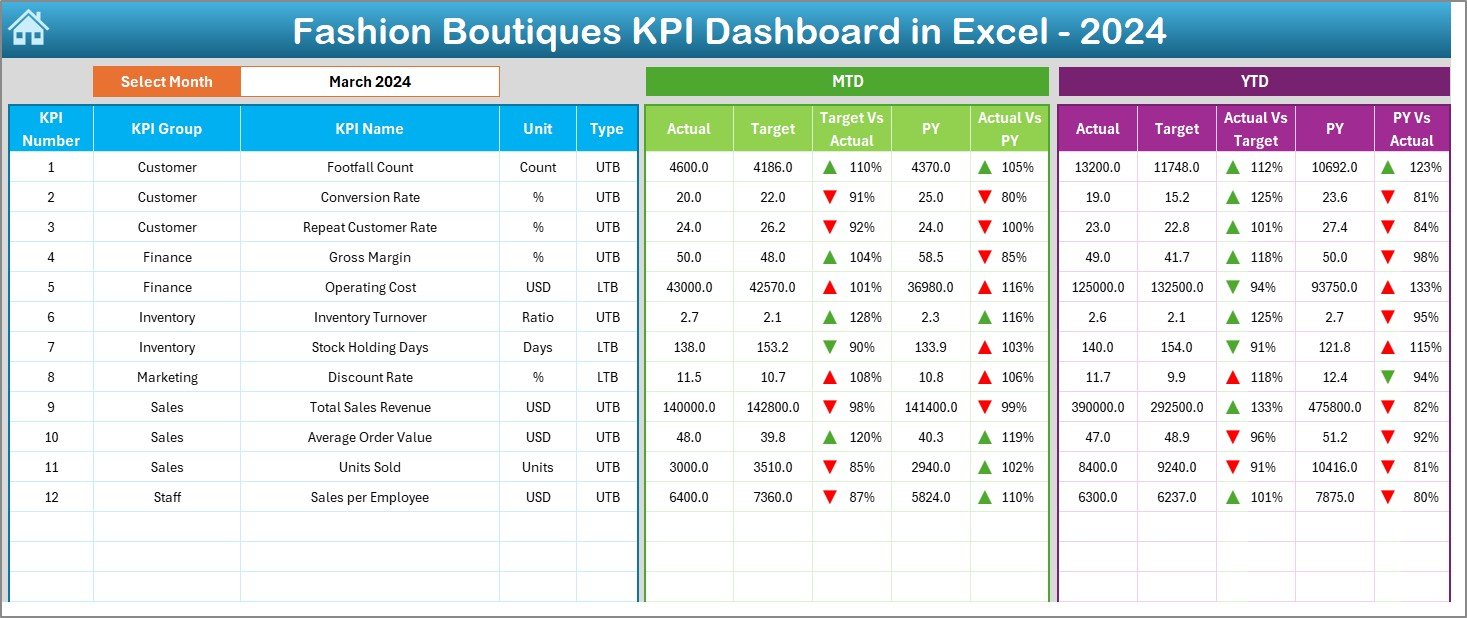
📌 Dashboard Sheet
Displays all KPIs with:
-
MTD & YTD Actual, Target, and Previous Year values
-
Target vs Actual & Previous Year vs Actual comparisons
-
Conditional formatting arrows for quick insights
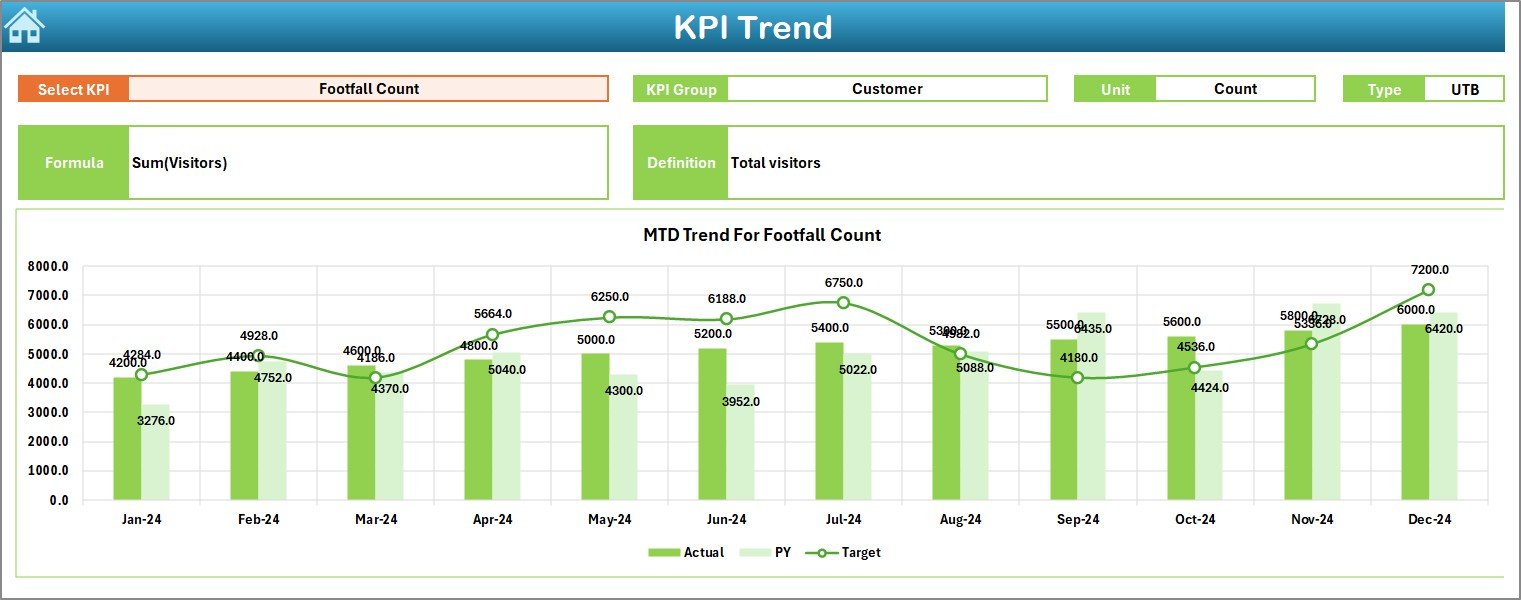
📌 Trend Sheet
Deep KPI-wise analysis with:
-
KPI selection drop-down
-
KPI group, unit, type, formula, and definition
-
MTD & YTD trend charts
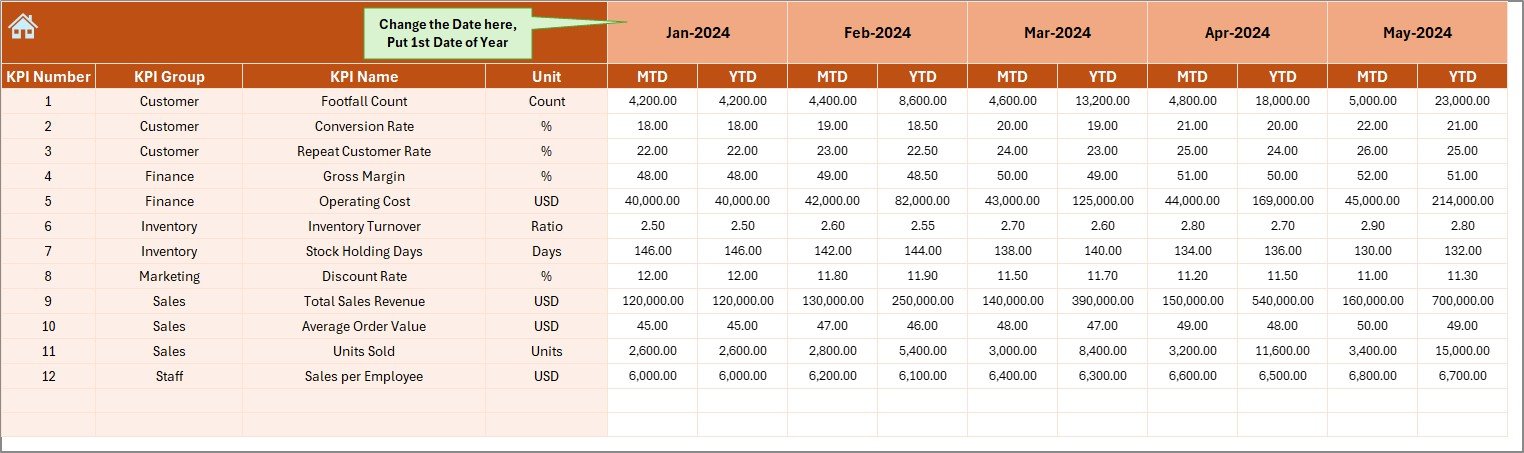
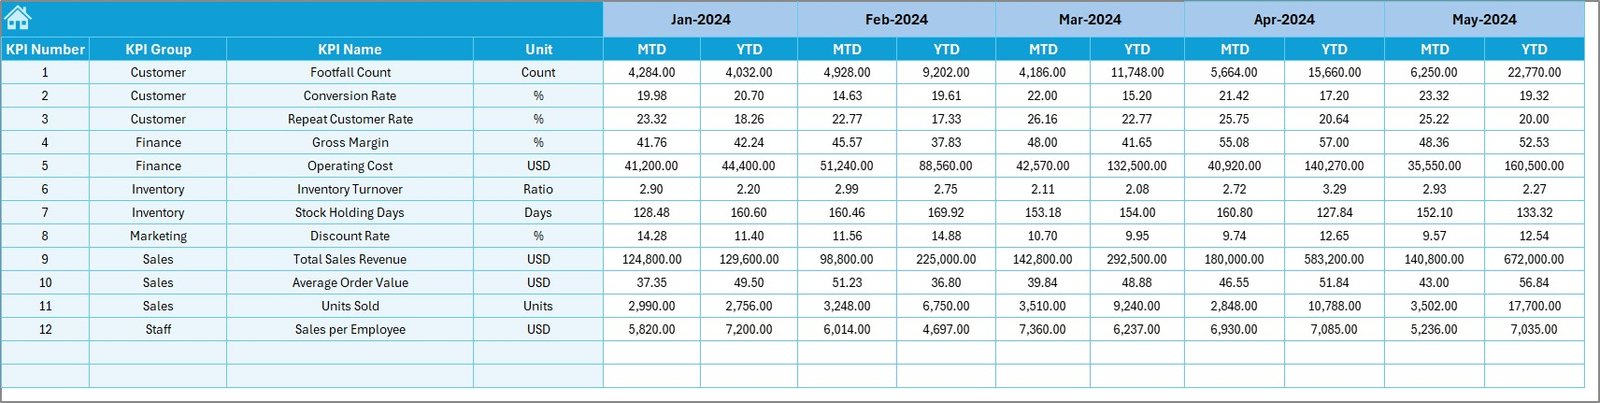
📌 Actual Numbers Sheet
Simple data entry sheet for monthly KPI actuals—dashboard updates automatically.
📌 Target Sheet
Define monthly KPI targets to track planned vs actual performance.
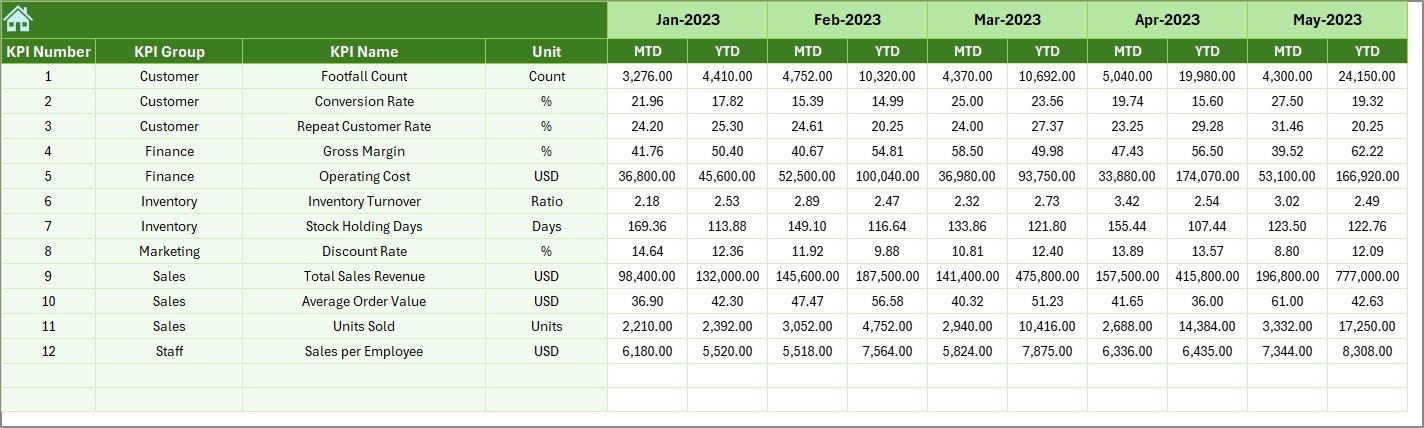
📌 Previous Year Sheet
Enter last year’s data to enable powerful year-over-year analysis.
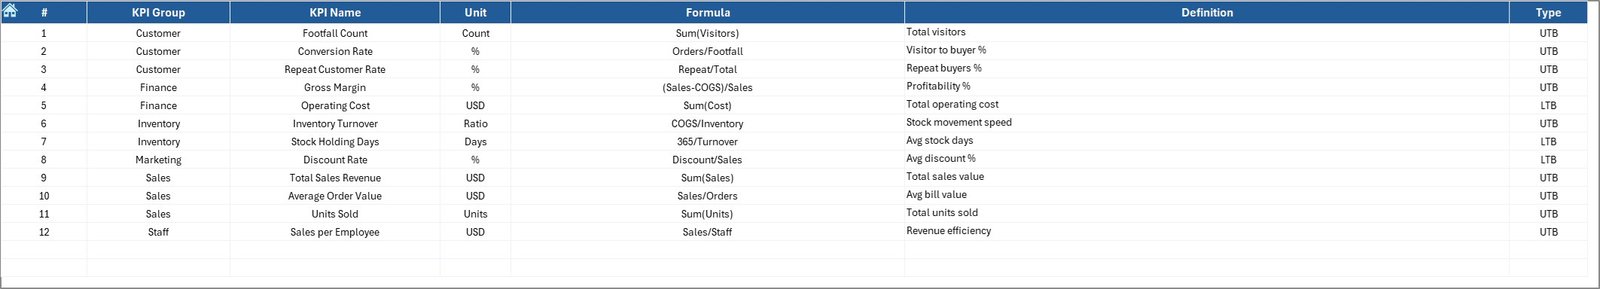
📌 KPI Definition Sheet
A reference guide explaining every KPI clearly to avoid confusion.
🧩 How to Use the Fashion Boutiques KPI Dashboard in Excel
✅ Step 1: Enter your monthly Actual KPI values in the Actual Numbers sheet
✅ Step 2: Define Targets in the Target sheet
✅ Step 3: Add Previous Year data for YoY comparison
✅ Step 4: Select the month from the Dashboard drop-down
✅ Step 5: Analyze MTD & YTD performance instantly
No advanced Excel skills are required—basic Excel knowledge is enough.
👗 Who Can Benefit from This Fashion Boutiques KPI Dashboard
👩💼 Boutique Owners – Gain full visibility into sales, inventory, and profitability
🏪 Store Managers – Monitor daily and monthly performance trends
📊 Retail Analysts – Perform KPI-driven analysis without BI tools
💼 Finance & Operations Teams – Track targets, margins, and growth efficiently
🚀 Growing Fashion Retailers – Scale performance monitoring with confidence
Click here to read the Detailed blog post
Watch the step-by-step video tutorial:


Reviews
There are no reviews yet.