Fashion boutiques don’t fail because they lack style… they fail because they lack visibility. Trends change overnight, customers switch preferences fast, and competition is always one step ahead. If you’re still relying on manual reports, scattered spreadsheets, or basic accounting summaries, you’re not managing your boutique—you’re guessing.
That’s why we built the Fashion Boutiques Dashboard in Excel 👗📊
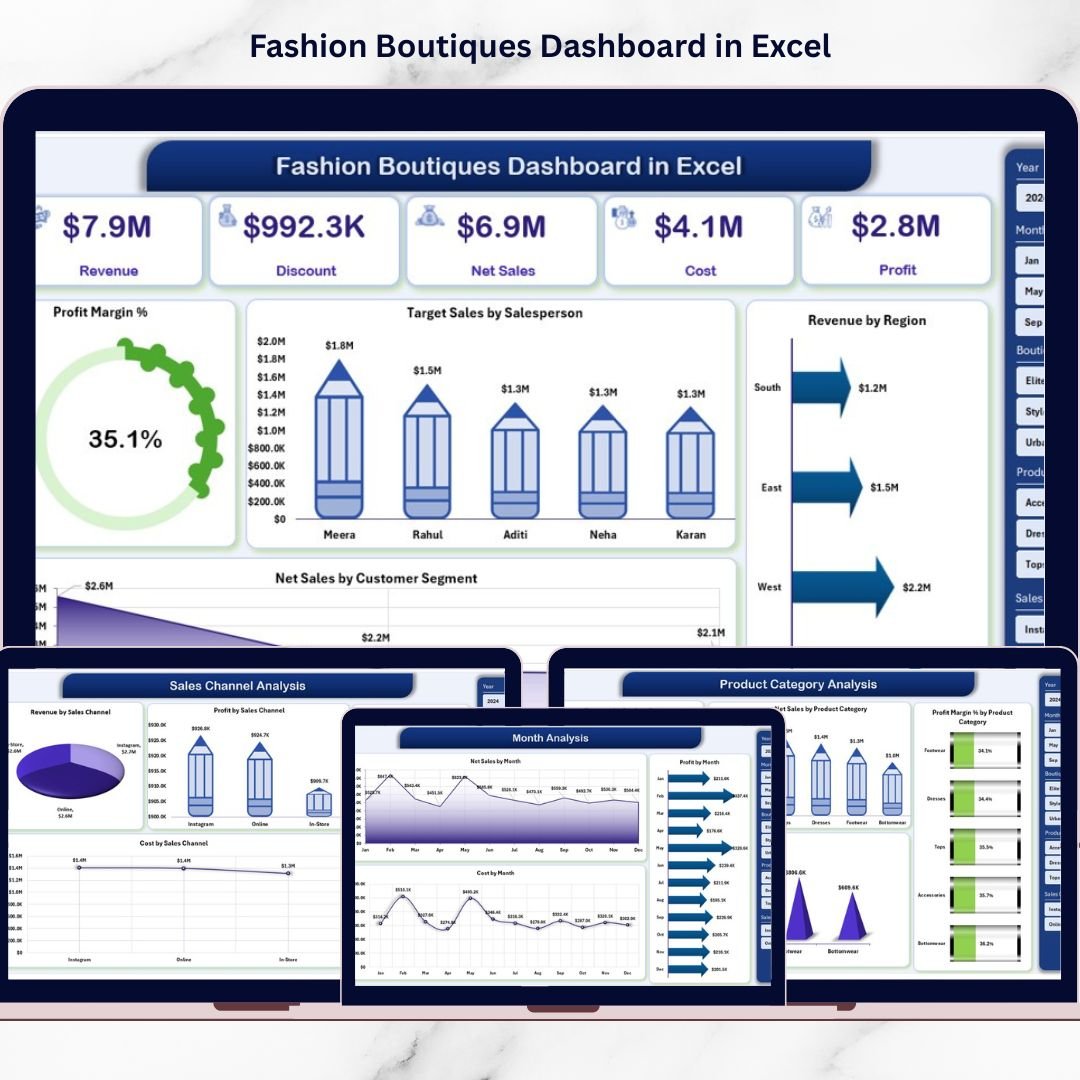
It’s a ready-to-use analytics template that transforms raw sales data into powerful business insights—so you can instantly track revenue, net sales, costs, and profit margin across boutiques, product categories, sales channels, and months.
This dashboard is designed for boutique owners and fashion retail managers who want a professional reporting system without expensive software. With slicers, KPI cards, and clean visuals, you’ll know exactly what’s working, what’s wasting money, and where to focus next.
Key Feature of Fashion Boutiques Dashboard in Excel
🚀 Ready-to-use Excel dashboard built for fashion boutique performance tracking
🧭 Page Navigator on the left to jump between analysis pages instantly
🎛️ Right-side slicers to filter insights by your business needs
📌 KPI Cards to highlight key performance at a glance
📈 5-page analytics structure covering stores, categories, channels, and trends
💰 Profit Margin % tracking to monitor profitability clearly
🎯 Target Sales by Salesperson to improve accountability and performance
🌍 Revenue by Region for location-wise insights
👥 Customer Segment analysis for smarter marketing decisions
🧾 Support + Data sheets for smooth automation and easy data updates
What’s Inside the Fashion Boutiques Dashboard in Excel
This template includes 5 powerful analytical pages, plus supporting sheets that run everything smoothly:
📌 1) Overview Page (Snapshot View)
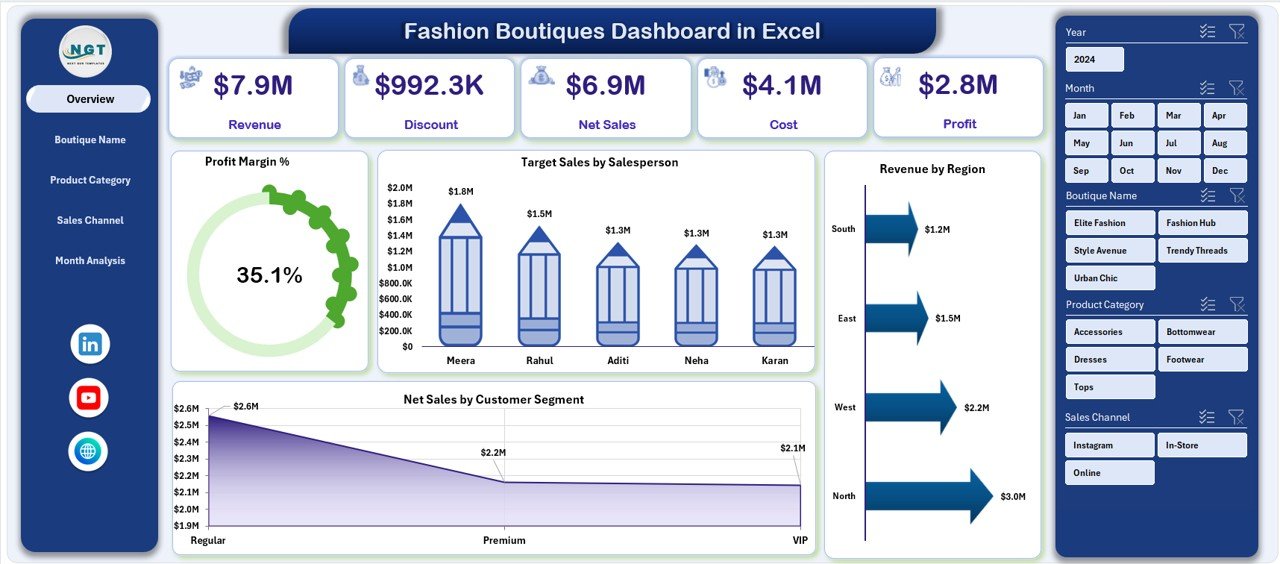
Your business performance command center with slicers, KPI cards, and key visuals:
-
Profit Margin %
-
Target Sales by Salesperson
-
Revenue by Region
-
Net Sales by Customer Segment
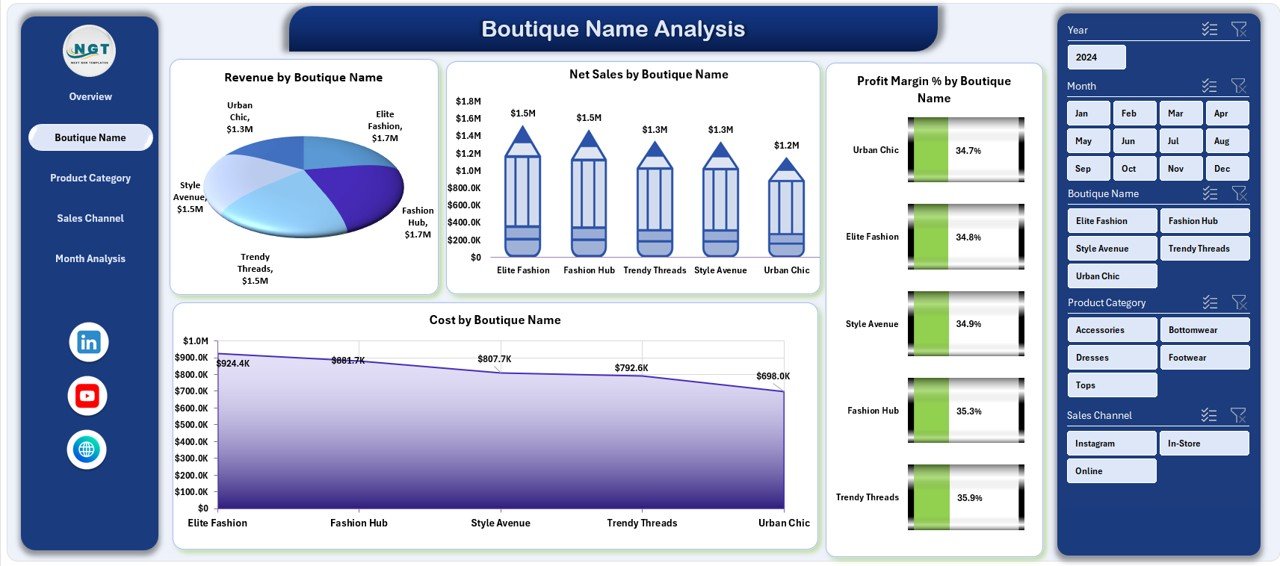
🏬 2) Boutique Name Analysis (Store Performance)
Compare boutiques and instantly spot winners and underperformers using:
-
Revenue by Boutique Name
-
Net Sales by Boutique Name
-
Profit Margin % by Boutique Name
-
Cost by Boutique Name
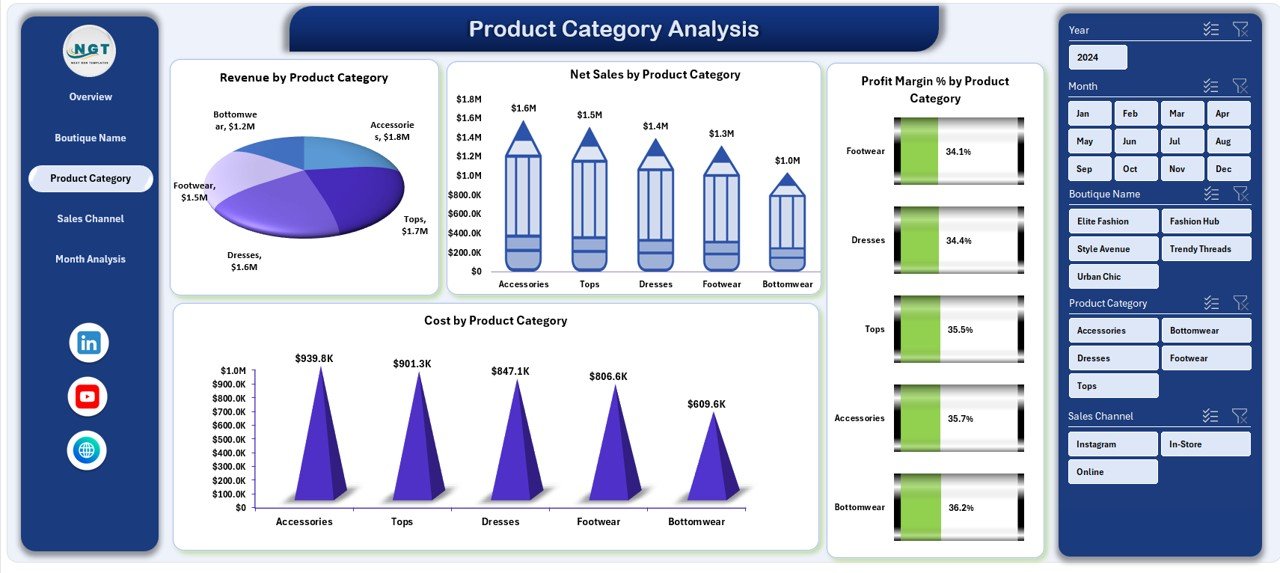
👗 3) Product Category Analysis (Trend + Inventory Insights)
Understand which categories drive sales and profit:
-
Revenue by Product Category
-
Net Sales by Product Category
-
Profit Margin % by Product Category
-
Cost by Product Category
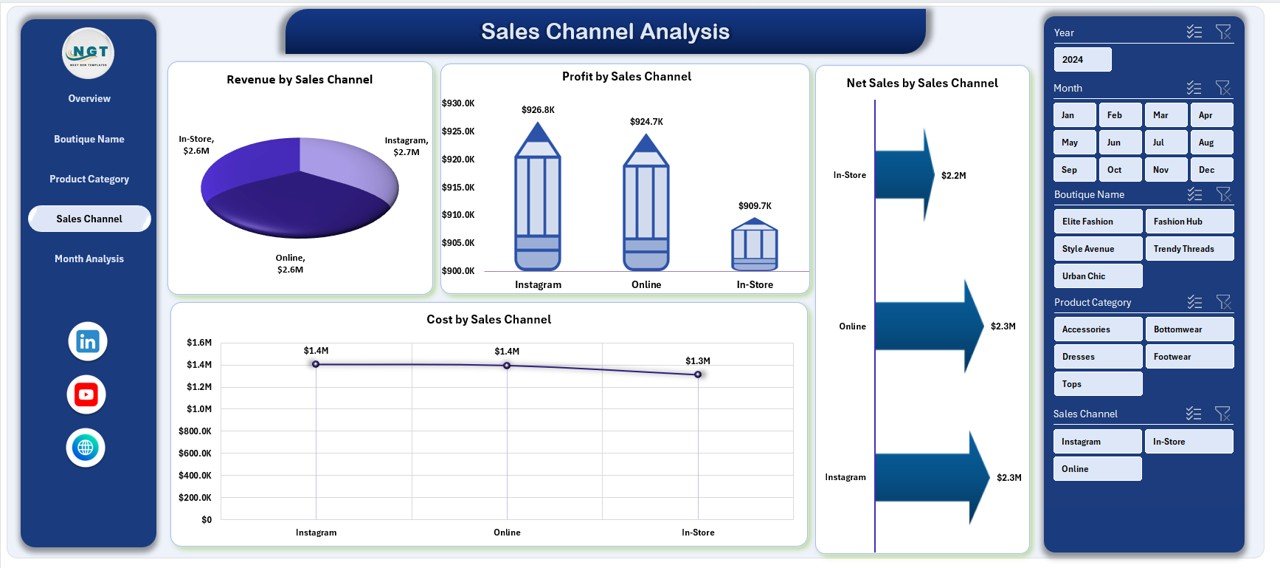
🛍️ 4) Sales Channel Analysis (Online vs Offline Profits)
See where your money really comes from:
-
Revenue by Sales Channel
-
Net Sales by Sales Channel
-
Profit by Sales Channel
-
Cost by Sales Channel
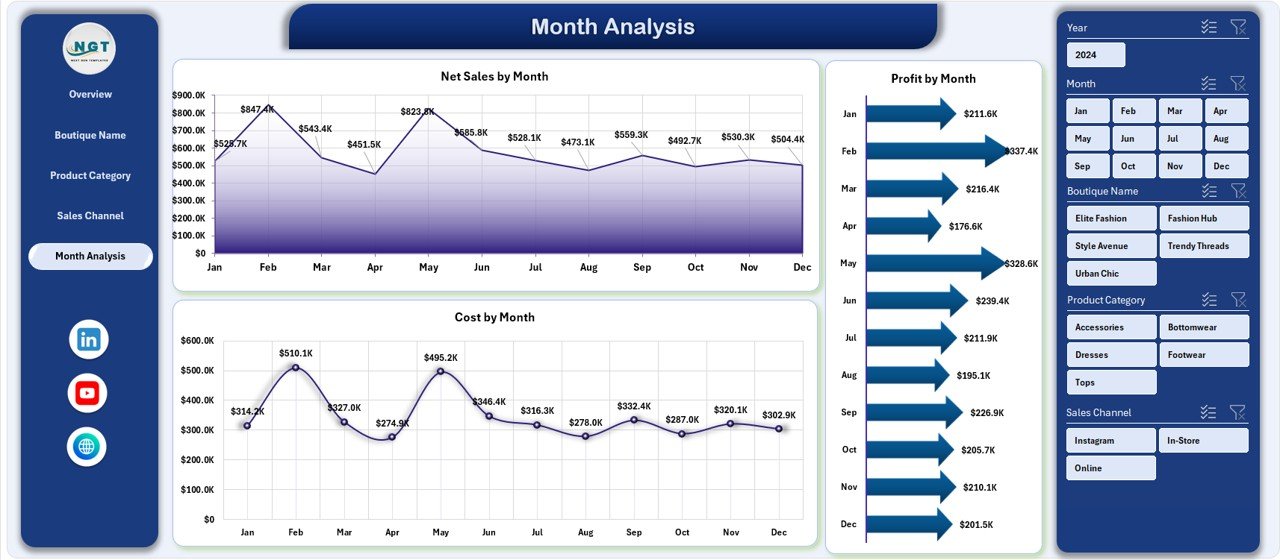
📅 5) Month Analysis (Seasonal & Time Trends)
Track performance over time to forecast better:
-
Net Sales by Month
-
Profit Margin by Month
-
Cost by Month
🧩 Support Sheet
Handles background calculations and structured references (no heavy manual work).
📂 Data Sheet
Your main input area to add sales transactions, boutique details, products, and channels.
How to Use the Fashion Boutiques Dashboard in Excel
You don’t need advanced Excel skills—just follow this simple workflow:
1️⃣ Enter/Update Data
Paste your latest transaction and master data into the Data Sheet.
2️⃣ Refresh the Dashboard
The visuals update automatically based on structured calculations.
3️⃣ Use Slicers for Quick Insights
Filter by region, month, category, boutique, channel, or segment to answer questions instantly.
4️⃣ Review the Overview First
Check Profit Margin %, salesperson targets, and overall sales distribution.
5️⃣ Deep-Dive into the Analysis Pages
Use Boutique, Category, Channel, and Month analysis pages to detect gaps, opportunities, and trends.
6️⃣ Take Action Faster
Shift inventory to high-performing boutiques, optimize underperforming channels, and control costs where needed.
Who Can Benefit from This Fashion Boutiques Dashboard in Excel
This dashboard is perfect for:
👗 Boutique Owners (single store or multi-store)
🏬 Fashion Retail Managers
🎯 Sales Managers & Team Leaders
💼 Finance & Profitability Analysts
📊 Retail Consultants
🛒 E-commerce & Omnichannel Managers
📦 Inventory & Category Planners
Whether you manage one boutique or a growing chain, this dashboard helps you run your business like a data-driven brand.
Click hare to read the Detailed blog post
Visit our YouTube channel to learn step-by-step video tutorials
Youtube.com/@PKAnExcelExpert


