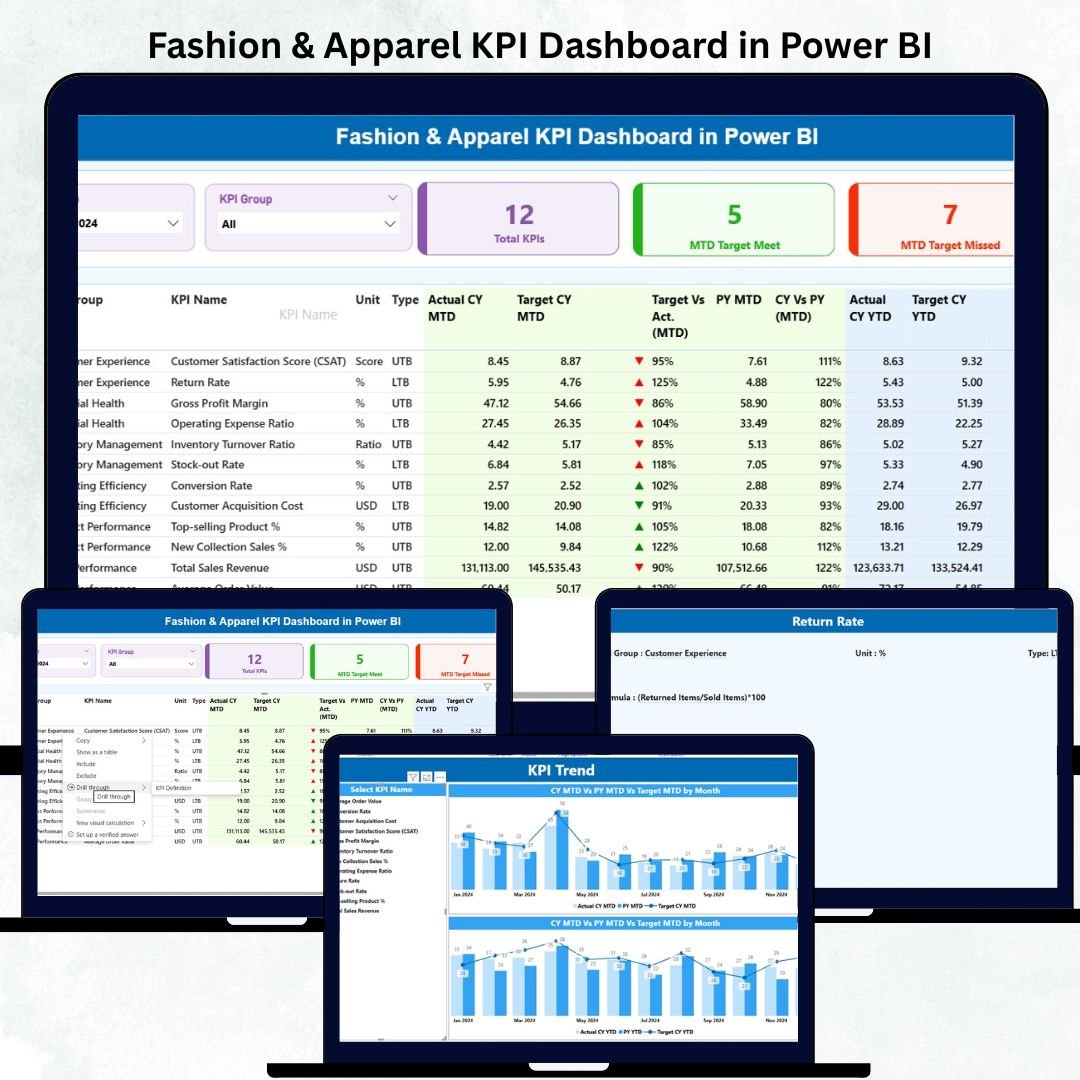
The fashion industry moves quickly—new trends, shifting customer demands, and constant seasonal changes keep retailers on their toes. To keep up, brands need fast insights, accurate KPIs, and clear dashboards that help them make confident decisions. That is exactly why we created the Fashion & Apparel KPI Dashboard in Power BI—a powerful, easy-to-use, and fully interactive dashboard designed to transform your raw Excel data into visual intelligence that helps you grow faster.
Whether you’re a retailer, wholesaler, apparel manufacturer, merchandiser, or store manager, this dashboard gives you full visibility into sales performance, product movement, stock levels, margins, and customer behavior—all in one place. No more scattered spreadsheets, no more manual calculations, and no more slow decision-making. With this dashboard, every performance insight comes alive instantly.Fashion & Apparel KPI Dashboard in Power BI
Below, you’ll discover everything included inside this amazing digital product.
✨ Key Features of the Fashion & Apparel KPI Dashboard in Power BI
The Fashion & Apparel KPI Dashboard gives you three fully designed pages packed with insights that help you understand performance in seconds.Fashion & Apparel KPI Dashboard in Power BI
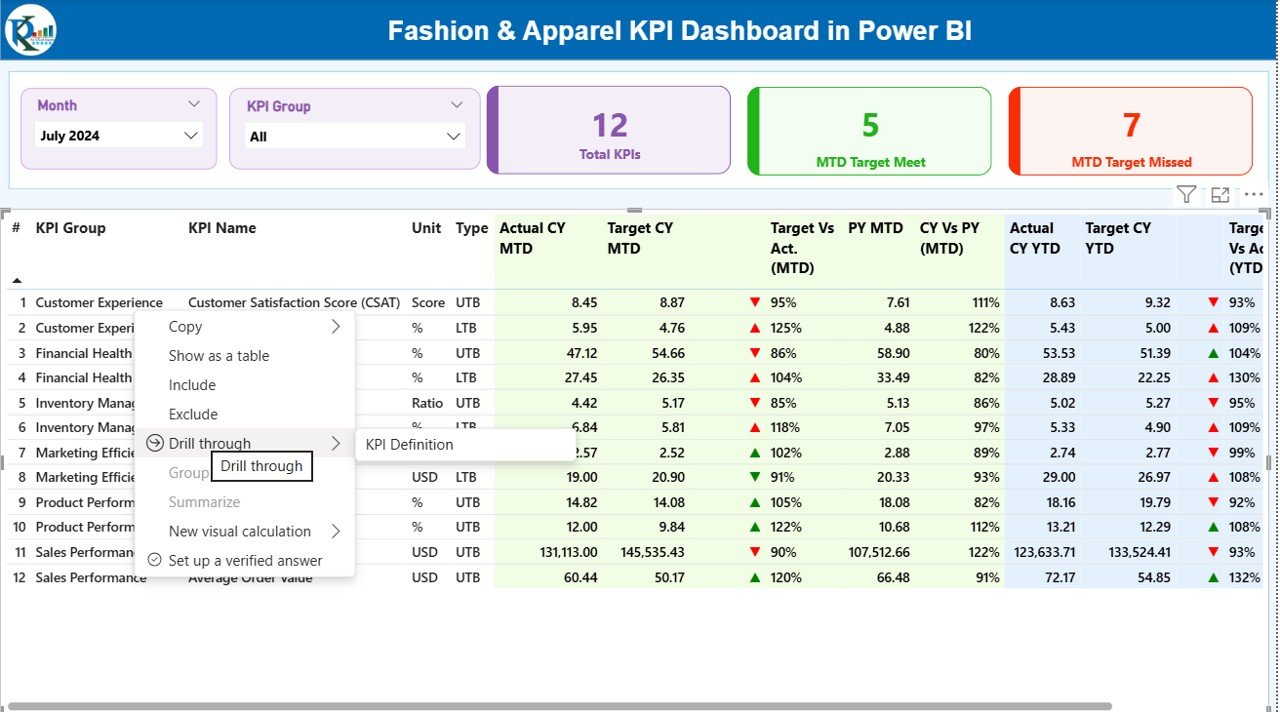
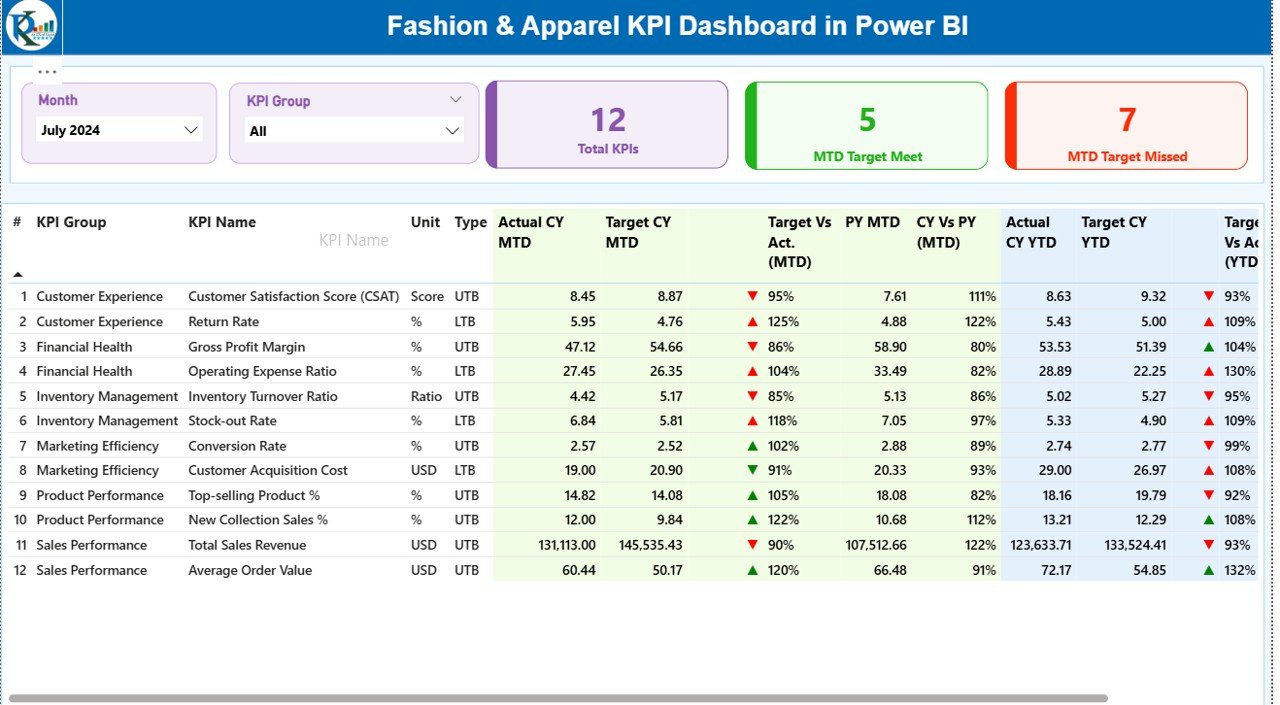
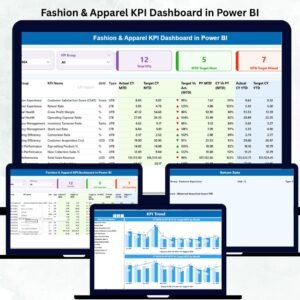
📊 Summary Page – Complete Business Snapshot
The Summary Page is the main control center of your dashboard. It includes:
-
Month Selector to switch between monthly performance
-
KPI Group Slicer to filter based on sales, inventory, merchandising, stores, and customers
-
KPI Cards showing Total KPIs, MTD Target Achieved, and MTD Target Missed
-
Detailed KPI Table containing:
-
KPI Number
-
KPI Name
-
Unit
-
UTB/LTB Type
-
Actual MTD vs Target MTD
-
Actual YTD vs Target YTD
-
Previous Year Comparisons
-
Performance Icons (Green ▲ / Red ▼)
-
Everything updates instantly when you select a month or KPI group.
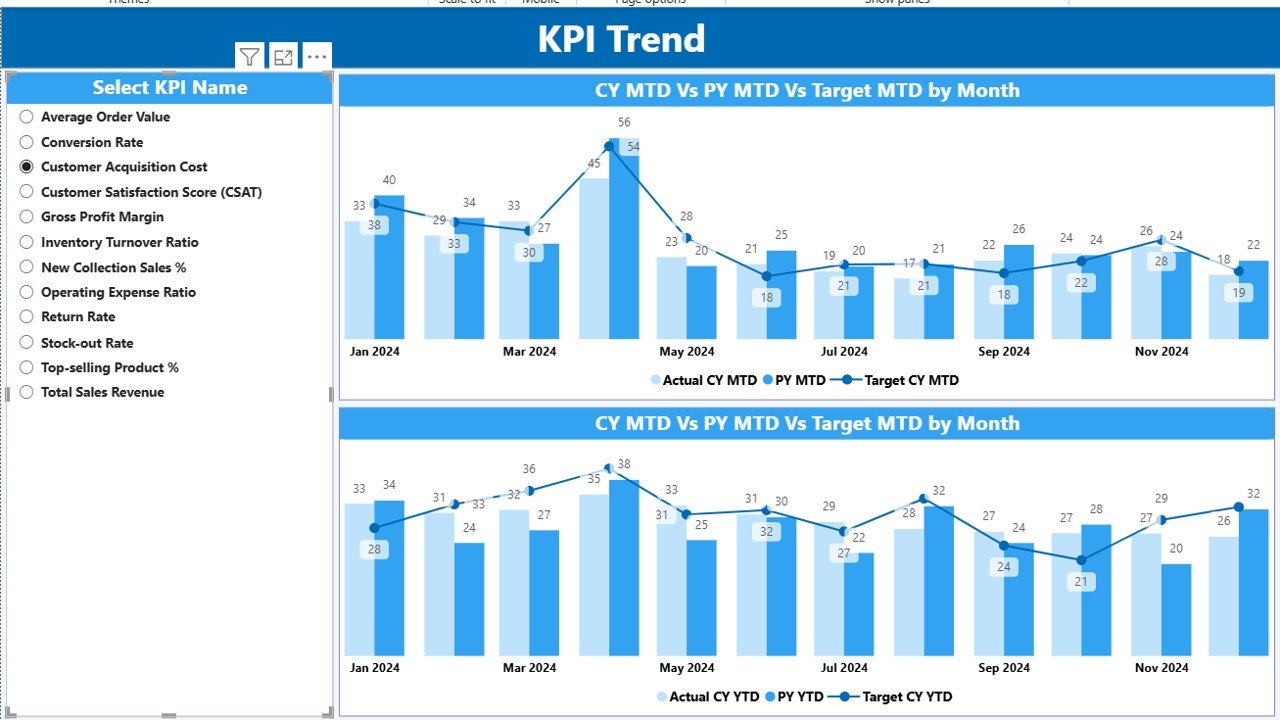
📉 KPI Trend Page – View Real Performance Trends
This page includes two combo charts:
-
MTD Trend Chart showing Actual vs Target vs Previous Year.Fashion & Apparel KPI Dashboard in Power BI
-
YTD Trend Chart comparing the long-term growth patterns
You can select a KPI from the slicer, and all charts update automatically. Perfect for identifying dips, improvements, or upcoming issues.
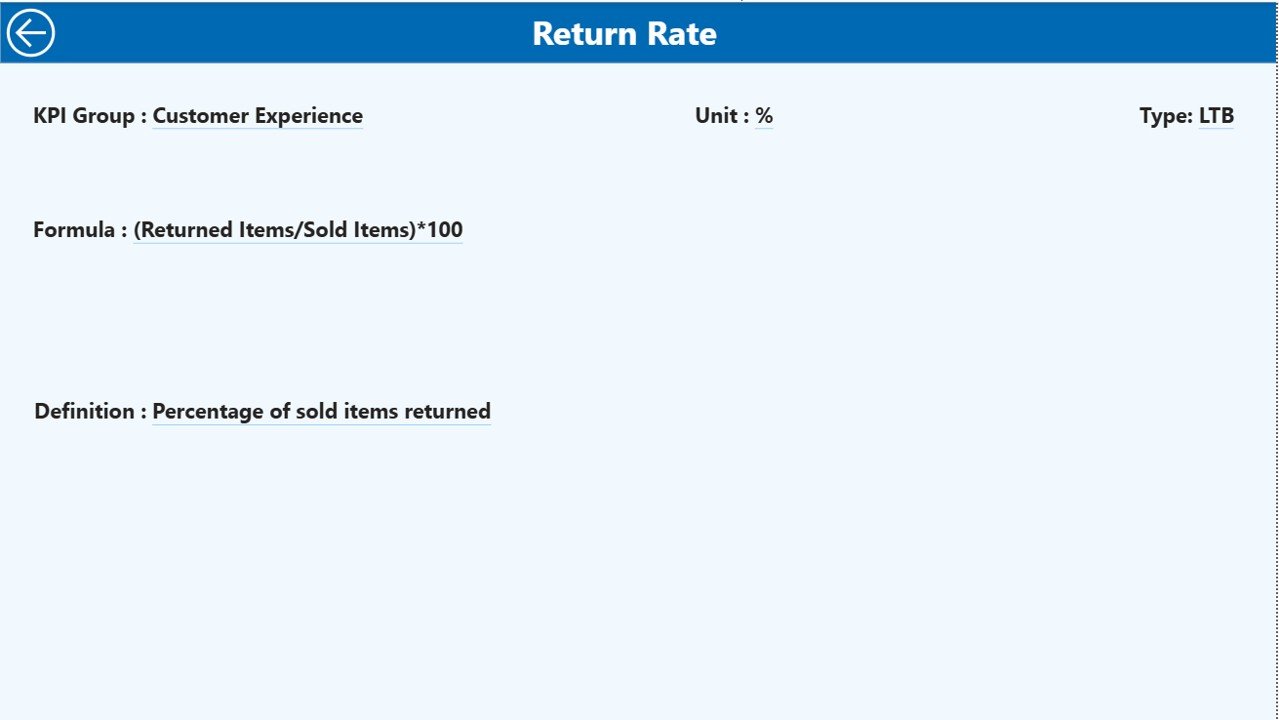
📘 KPI Definition Page – Full Transparency
Here you can drill through and check:
-
KPI Formula
-
Definition
-
Category
-
Unit
-
Type (UTB or LTB)
This ensures your team knows exactly how each KPI is calculated.
📦 What’s Inside the Fashion & Apparel KPI Dashboard
When you purchase this digital product, you get:
🟩 1. Fully Interactive Power BI Dashboard (.PBIX)
Ready to use and professionally designed for fashion and apparel businesses.
🟦 2. Structured Excel Data File
Includes three essential tabs:
-
Input_Actual (MTD/YTD values)
-
Input_Target (targets for each month)
-
KPI Definition (KPI name, formula, unit, type)
📝 3. Clear KPI List for Fashion Industry
Includes sales KPIs, merchandising KPIs, inventory KPIs, customer KPIs, and store KPIs.
💡 4. Complete User Guide (within dashboard)
Helps you load data, update KPIs, and customize visuals in minutes.
🧭 How to Use the Fashion & Apparel KPI Dashboard in Power BI
Using this dashboard is extremely simple—even for beginners.
🔹 Step 1: Update Your Excel File
Fill MTD & YTD numbers every month
Use the first date of each month (e.g., 01-Jan-2024)
🔹 Step 2: Load Excel Data into Power BI
Click Refresh — all visuals update instantly.
🔹 Step 3: Select Your Month & KPI Group
Watch all KPI cards, charts, and tables update automatically.
🔹 Step 4: Drill Through for Details
Click a KPI → open the Definition Page for formula & explanation.
🔹 Step 5: Review MTD, YTD & PY Trends
Use the trend charts to spot opportunities and risks before they grow.
👥 Who Can Benefit from This Fashion & Apparel Dashboard
This digital product is perfect for:
🛍️ Fashion Retail Stores
Track store-wise sales, footfall conversions, and product category trends.
🏭 Apparel Manufacturers
Monitor production KPIs, quality KPIs, stock age, and capacity utilization.
🛒 eCommerce Fashion Brands
Analyze online vs offline performance, return rates, customer KPIs, and margins.
👗 Merchandisers & Buyers
Track category demand, stock turnover, sell-through rate, and markdown %.
📦 Inventory & Supply Chain Teams
Monitor replenishment needs, slow-moving stock, reorder levels, and stock aging.
👔 Brand Managers & Executives
Get a complete business view for fast decision-making.
If your fashion business needs speed, clarity, and real-time insights, then this dashboard is exactly what you need.
### Click here to read the Detailed blog post
Watch the step-by-step video tutorial:


Reviews
There are no reviews yet.