Export Compliance KPI Dashboard is no longer a back-office task—it is a business-critical function. One missed regulation, delayed document, or compliance failure can lead to heavy penalties, shipment holds, or reputational damage. Yet many organizations still rely on scattered Excel files, emails, and manual reports. As a result, visibility remains low and risks stay hidden.
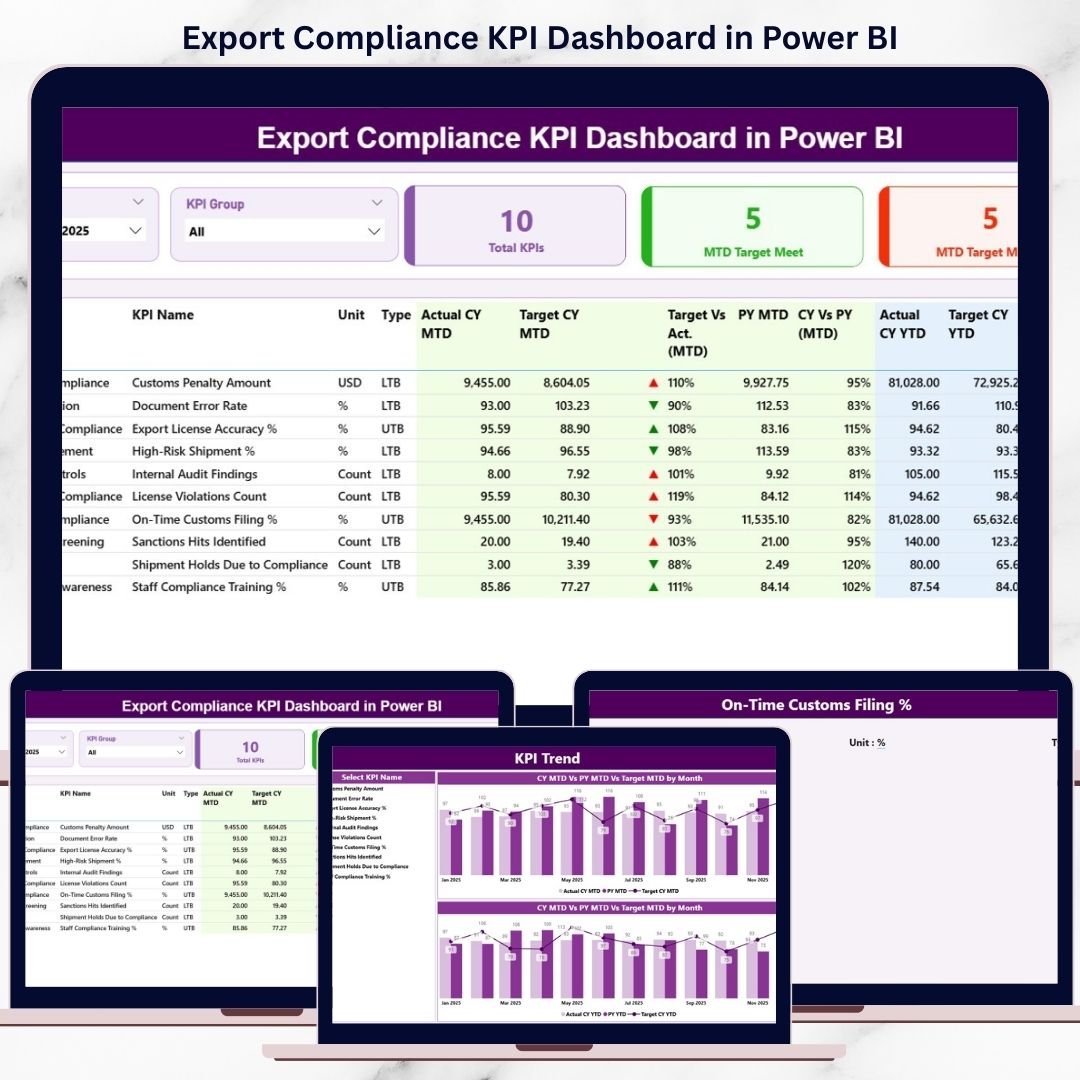
The Export Compliance KPI Dashboard in Power BI is a ready-to-use, interactive compliance monitoring solution that brings complete clarity into export compliance performance. Instead of juggling multiple reports, you get a single, centralized Power BI dashboard that tracks MTD and YTD compliance KPIs, compares Actual vs Target vs Previous Year, highlights risks instantly, and keeps your organization audit-ready at all times.
This dashboard turns compliance data into actionable insights, not just reports.
🚀 Key Features of Export Compliance KPI Dashboard in Power BI
📊 Centralized Compliance Monitoring – Track all export compliance KPIs from one dashboard
📅 MTD & YTD Performance Tracking – Monitor short-term and long-term compliance trends
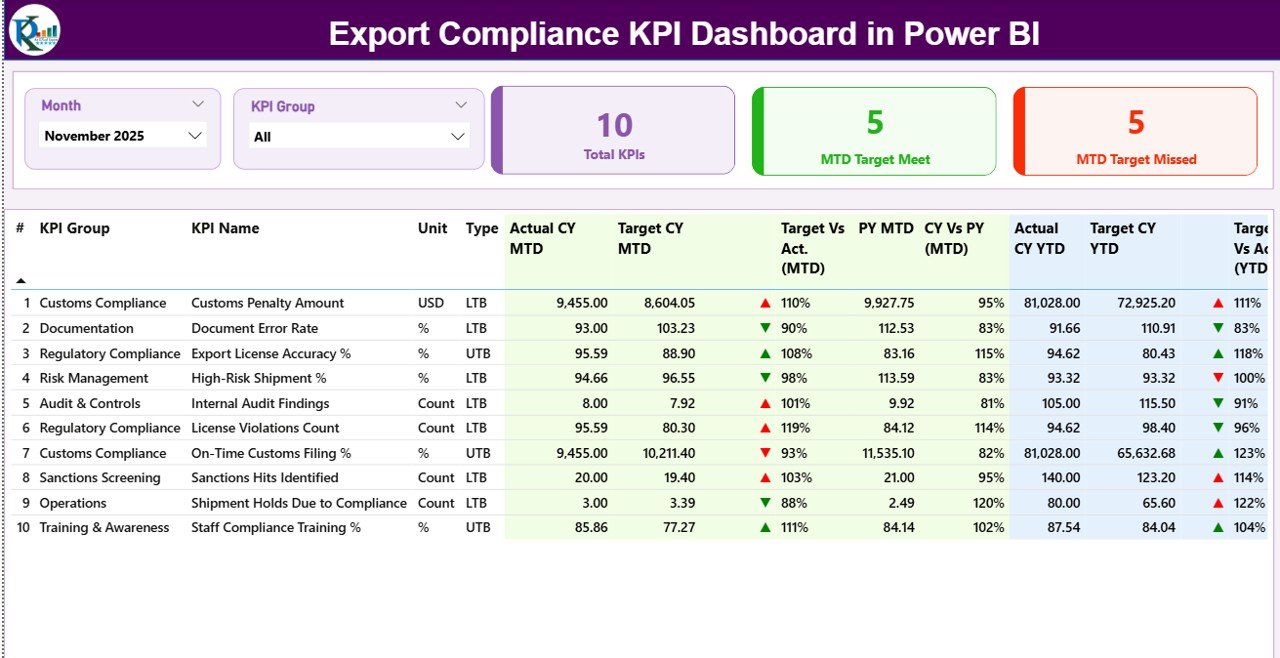
🎯 Target vs Actual Comparison – Instantly spot deviations using icons and percentages
📈 CY vs PY Analysis – Measure compliance improvement year-over-year
🧩 Month & KPI Group Slicers – Filter compliance performance dynamically
🚨 Visual Risk Indicators – Green ▲ and Red ▼ icons highlight issues instantly
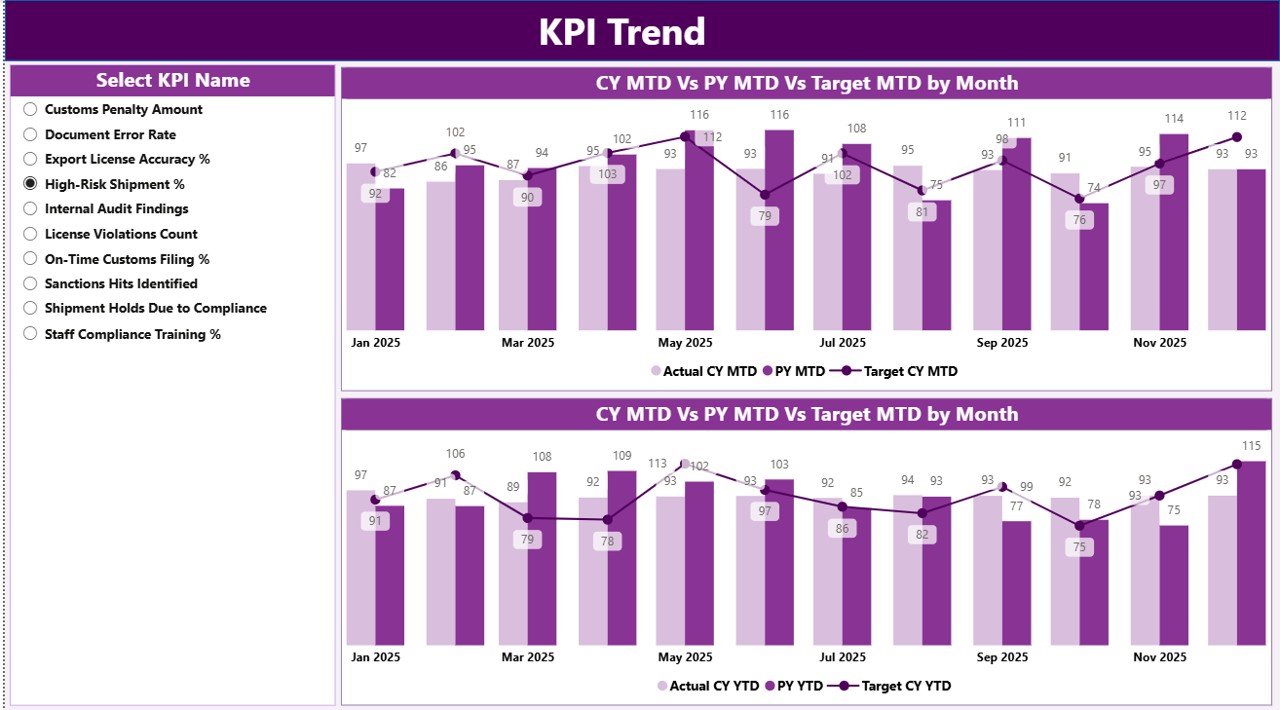
📉 KPI Trend Analysis – Analyze compliance behavior over time
🔄 Excel-Based Data Source – Update Excel, refresh Power BI, and you’re done
📦 What’s Inside the Export Compliance KPI Dashboard in Power BI
📁 Power BI (.pbix) File with a professionally designed compliance dashboard
📊 Summary Page – Main control panel with KPI cards and detailed performance table
📌 KPI Cards displaying:
-
Total KPIs Count
-
MTD Target Met Count
-
MTD Target Missed Count
📋 Detailed KPI Table including:
-
KPI Number
-
KPI Group
-
KPI Name
-
Unit
-
KPI Type (LTB / UTB)
📈 MTD Metrics:
-
Actual CY MTD
-
Target CY MTD
-
Status Icon
-
Target vs Actual %
-
PY MTD
-
CY vs PY %
📊 YTD Metrics:
-
Actual CY YTD
-
Target CY YTD
-
Status Icon
-
Target vs Actual %
-
PY YTD
-
CY vs PY %
📉 KPI Trend Page – MTD and YTD trend charts for deep analysis
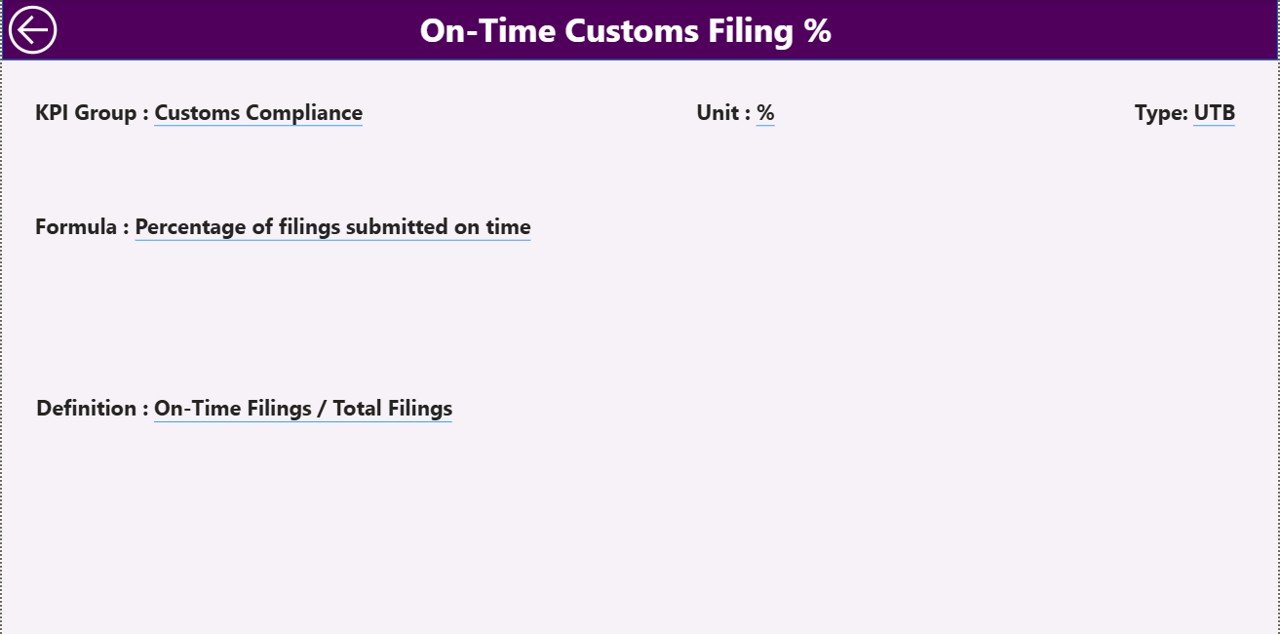
📘 KPI Definition Page – Drill-through page with KPI formulas and definitions
🧠 How to Use the Export Compliance KPI Dashboard in Power BI
1️⃣ Update Actual and Target KPI values in the Excel input file
2️⃣ Open the Power BI dashboard file
3️⃣ Click Refresh to update all visuals
4️⃣ Select the reporting month using the slicer
5️⃣ Filter KPIs using the KPI Group slicer
6️⃣ Review MTD and YTD compliance performance
7️⃣ Drill through KPIs to understand formulas and logic
No advanced Power BI skills are required. The dashboard is intuitive, structured, and business-ready.
👥 Who Can Benefit from This Export Compliance KPI Dashboard in Power BI
📦 Export Compliance Officers – Monitor compliance risks proactively
📋 Trade Compliance Managers – Track violations and regulatory performance
🚚 Logistics & Shipping Teams – Monitor screening and documentation KPIs
🔍 Risk & Audit Teams – Maintain audit-ready compliance visibility
👔 Senior Management – Get a high-level compliance snapshot instantly
This dashboard works for SMEs as well as large global exporters.
🔗 Click here to read the Detailed Blog Post
🎥 Visit our YouTube channel to learn step-by-step video tutorials
https://www.youtube.com/@PKAnExcelExpert


Reviews
There are no reviews yet.