


The Event Management KPI Dashboard in Power BI is a powerful tool designed for event planners, organizers, and companies that manage conferences, festivals, corporate events, and other large-scale gatherings. This Power BI-based dashboard provides real-time insights into key performance indicators (KPIs) such as ticket sales, event attendance, budget performance, vendor management, and attendee satisfaction.
With interactive features and customizable data visualizations, this dashboard allows you to track event progress, optimize resources, and ensure the seamless execution of events, while also improving profitability and participant experience.
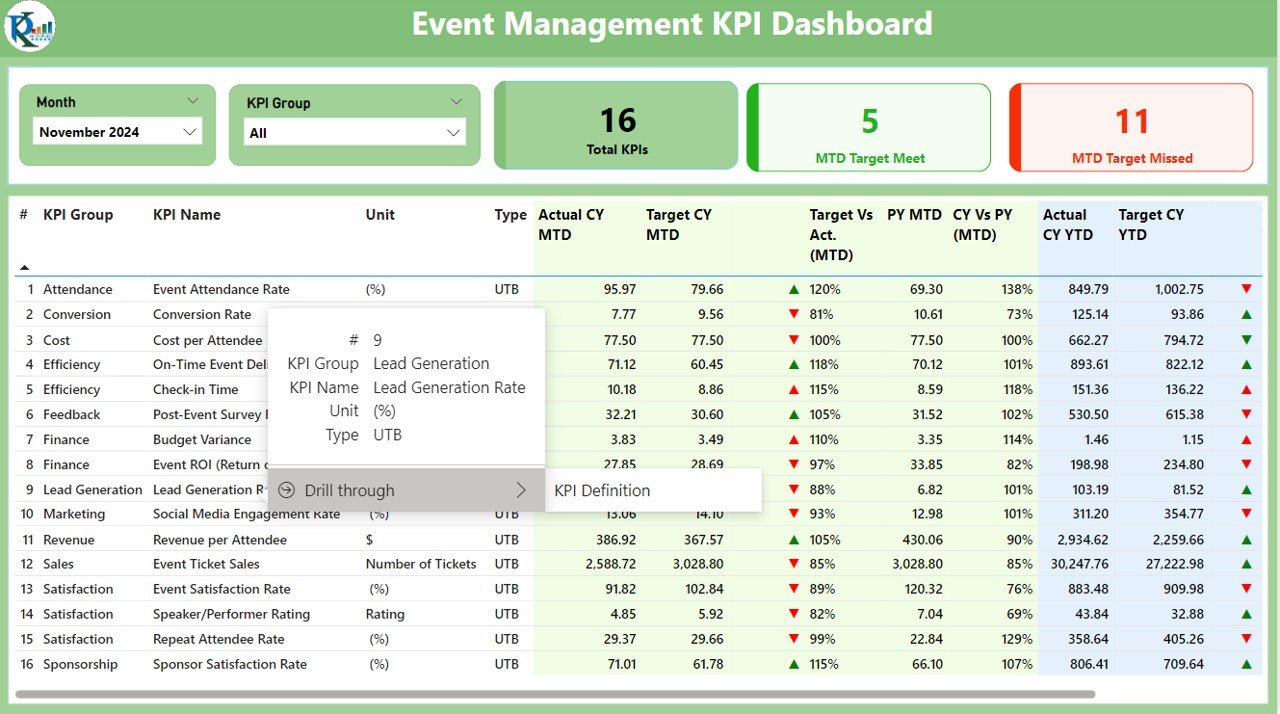
Key Features of the Event Management KPI Dashboard in Power BI:
🎟️ Ticket Sales and Revenue Tracking
Monitor ticket sales, revenue generation, and sales trends for different types of tickets (VIP, general admission, etc.) to ensure financial goals are met.
💰 Budget and Expense Management
Track event budgets, expenses, and financial forecasts to ensure that events stay within budget, and identify areas for cost optimization.
📊 Event Attendance and Engagement
Track attendee registrations, attendance rates, and participant engagement to measure the success of marketing campaigns and event popularity.
👥 Vendor and Supplier Performance
Monitor vendor contracts, service delivery, and performance to ensure all event vendors are meeting expectations and contributing to event success.
📈 Attendee Feedback and Satisfaction
Track attendee feedback, surveys, and satisfaction scores to ensure the event meets participant expectations and improve future event planning.
🚀 Why You’ll Love the Event Management KPI Dashboard in Power BI:
✅ Track Ticket Sales and Revenue – Monitor ticket sales and revenue generation across multiple ticket categories to track financial success.
✅ Evaluate Financial Performance – Track event budgets, expenses, and revenue to ensure financial goals are met and resources are used efficiently.
✅ Measure Event Attendance and Engagement – Monitor attendee registrations and track participation to optimize event planning and marketing efforts.
✅ Manage Vendor Performance – Track vendor performance and service delivery to ensure that all event suppliers are meeting their contractual obligations.
✅ Enhance Attendee Satisfaction – Track attendee feedback and satisfaction ratings to ensure a high-quality participant experience and identify areas for improvement.
✅ Fully Customizable and Interactive – Tailor the dashboard to meet the specific needs of your events with dynamic features and real-time data insights.
What’s Inside the Event Management KPI Dashboard in Power BI:
-
Ticket Sales and Revenue Tracking: Track ticket sales by category (VIP, general admission, etc.) and monitor revenue generation to ensure financial success.
-
Budget and Financial Performance: Track event budgets, expenses, and financial forecasts to keep the event within budget and optimize resources.
-
Event Attendance and Engagement: Monitor attendee registrations, attendance rates, and engagement metrics to assess the effectiveness of event promotion and audience engagement.
-
Vendor and Supplier Management: Track vendor performance, service quality, and contract adherence to ensure smooth event execution.
-
Attendee Feedback and Satisfaction: Gather feedback, monitor satisfaction scores, and track post-event surveys to improve future event planning and execution.
-
Custom Reports: Generate detailed reports summarizing ticket sales, attendance, financial performance, vendor management, and attendee satisfaction for better decision-making.
How to Use the Event Management KPI Dashboard in Power BI:
1️⃣ Download the Template – Instantly access your Power BI file upon purchase.
2️⃣ Input Event Data – Enter ticket sales, budget details, attendee registration data, vendor information, and satisfaction scores to begin tracking KPIs.
3️⃣ Monitor Key Metrics – Use the dashboard to track ticket sales, revenue, attendance, vendor performance, and attendee feedback in real-time.
4️⃣ Evaluate Financials – Track event budgets, expenses, and revenue to ensure financial goals are met and costs are controlled.
5️⃣ Generate Reports – Create custom reports summarizing event performance, including financial performance, attendance, and satisfaction, to inform future event strategies.
Who Can Benefit from the Event Management KPI Dashboard in Power BI:
-
Event Planners and Organizers
-
Conference and Festival Organizers
-
Corporate Event Managers
-
Marketing Teams for Events
-
Financial Analysts in Event Management
-
Vendor and Supplier Managers
-
Event Operations Teams
-
Customer Engagement and Satisfaction Teams
-
Event Sponsors and Stakeholders
-
Trade Show and Expo Organizers
The Event Management KPI Dashboard in Power BI is the ideal tool for efficiently managing event logistics, optimizing resource allocation, and ensuring that your events meet financial, operational, and participant satisfaction goals. By tracking key performance metrics such as ticket sales, vendor performance, and attendee feedback, this dashboard helps ensure the success of your events.
Click here to read the Detailed blog post
https://www.pk-anexcelexpert.com/event-management-kpi-dashboard-in-power-bi/
Visit our YouTube channel to learn step-by-step video tutorials
Youtube.com/@PKAnExcelExpert


Reviews
There are no reviews yet.