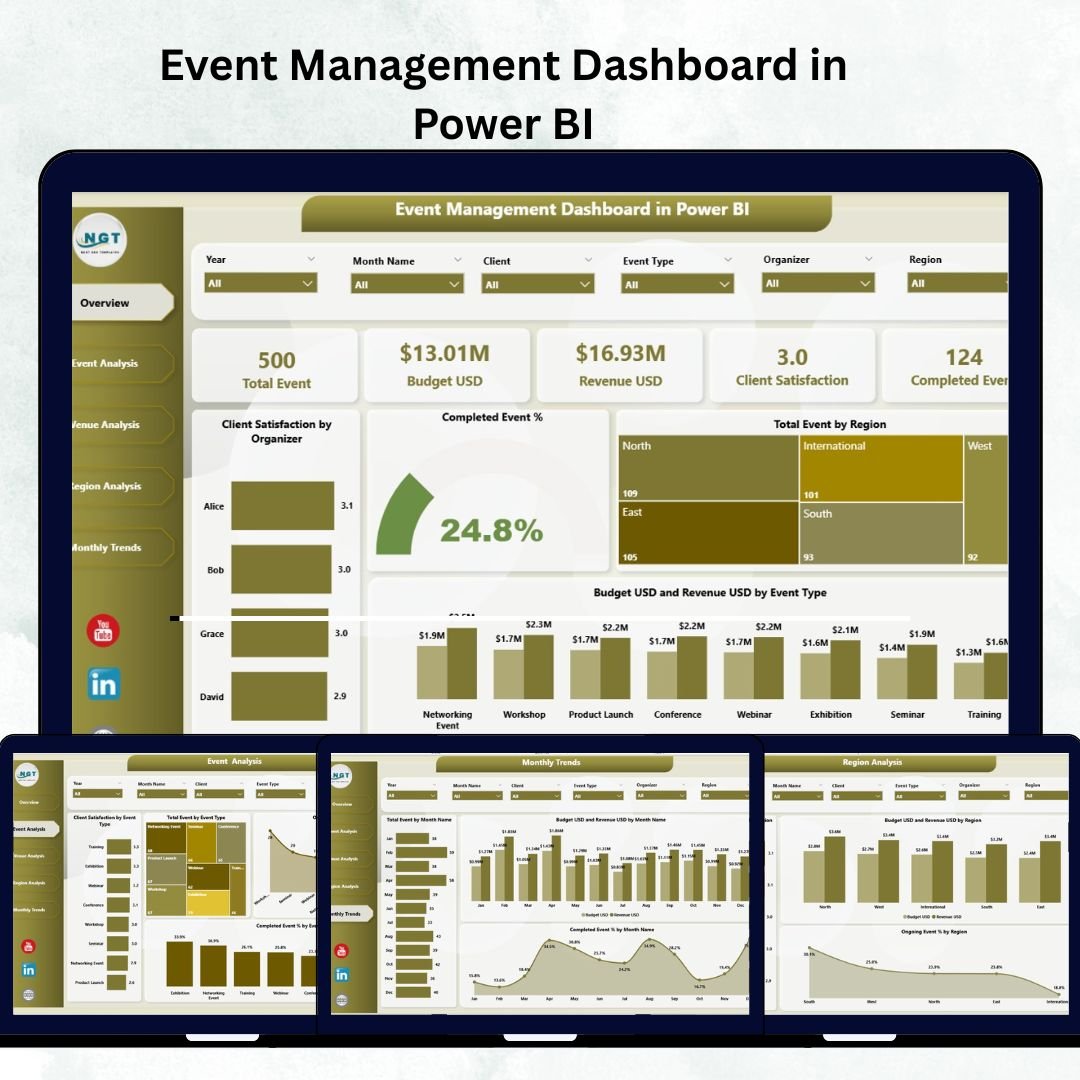
Running successful events requires more than great planning — it demands real-time insights. Whether you manage corporate conferences, exhibitions, concerts, or workshops, the Event Management Dashboard in Power BI helps you visualize every key metric that defines success.
Built entirely in Microsoft Power BI, this ready-to-use interactive dashboard connects your event data from Excel or databases and turns it into dynamic visuals. From budgets to satisfaction scores, every detail is consolidated into one central platform — empowering managers to make fast, data-driven decisions.
No coding, no manual reports — just clean, visual intelligence that lets you track performance, measure ROI, and improve event operations instantly.
⚙️ Key Features of the Event Management Dashboard in Power BI
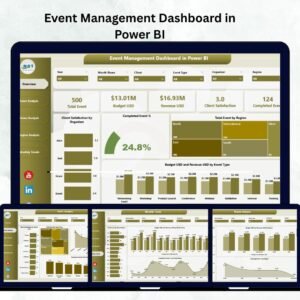
🏠 1️⃣ Overview Page – Your Command Center
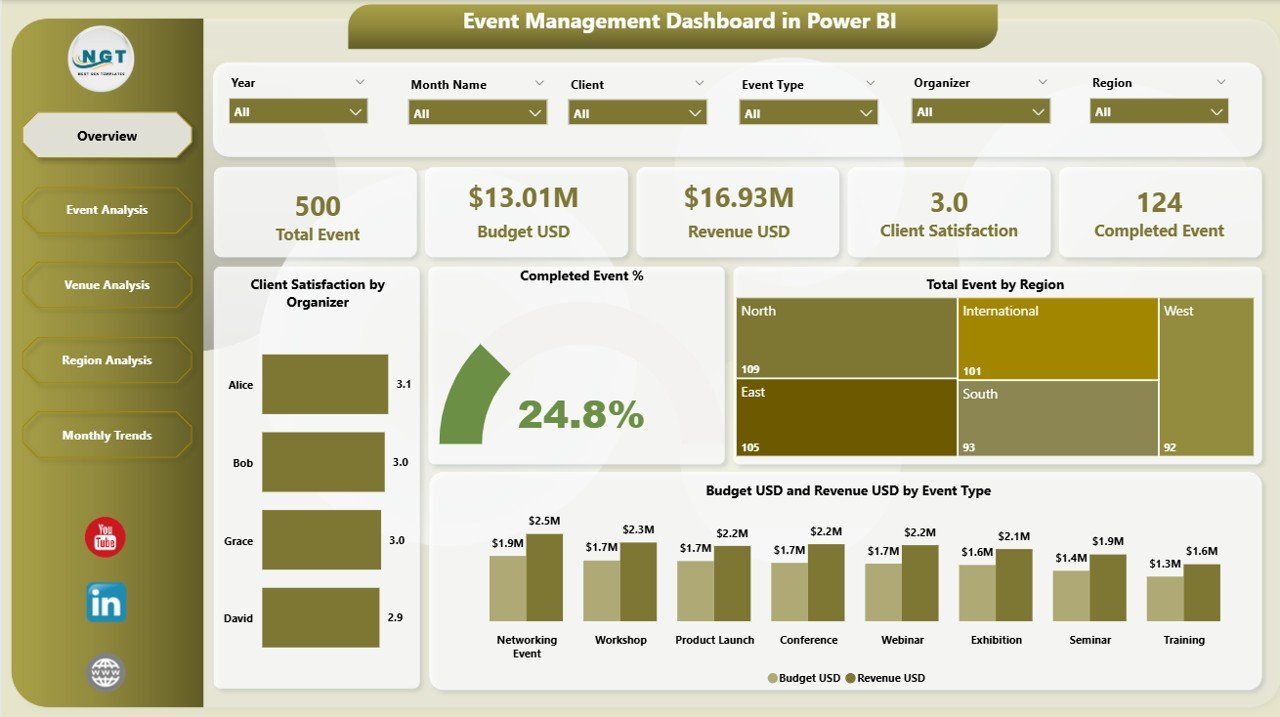
Gain a 360° view of all ongoing and completed events.
Highlights:
-
🎯 Interactive slicers to filter by Region, Event Type, or Organizer.
-
📊 Visual KPIs:
-
Client Satisfaction by Organizer
-
Completed Event %
-
Total Events by Region
-
Budget (USD) vs Revenue (USD) by Event Type
-
💡 Perfect for quick board-level summaries and performance reviews.
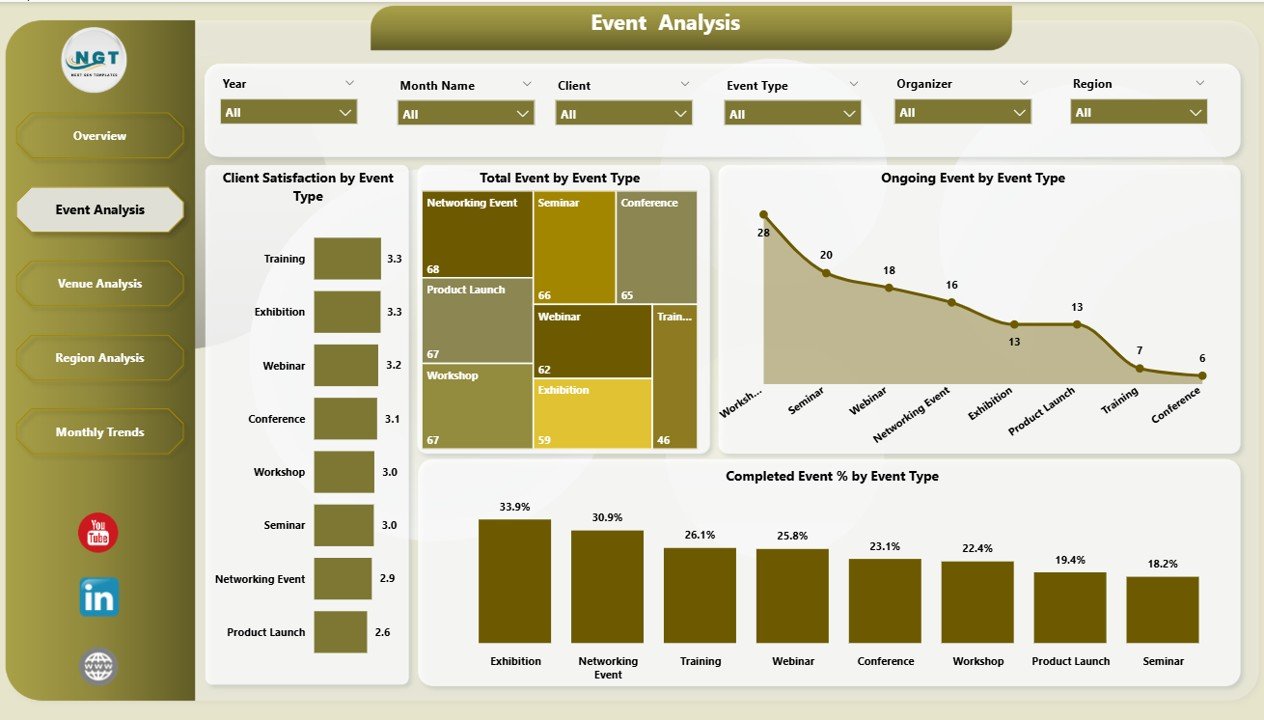
🎪 2️⃣ Event Analysis Page – Compare Event Types & Performance
Analyze your full event portfolio in seconds.
Visuals include:
-
Client Satisfaction by Event Type
-
Total Events by Event Type
-
Ongoing vs Completed Events
📈 Identify which event categories deliver the best satisfaction or profitability, and spot underperforming types before they impact results.
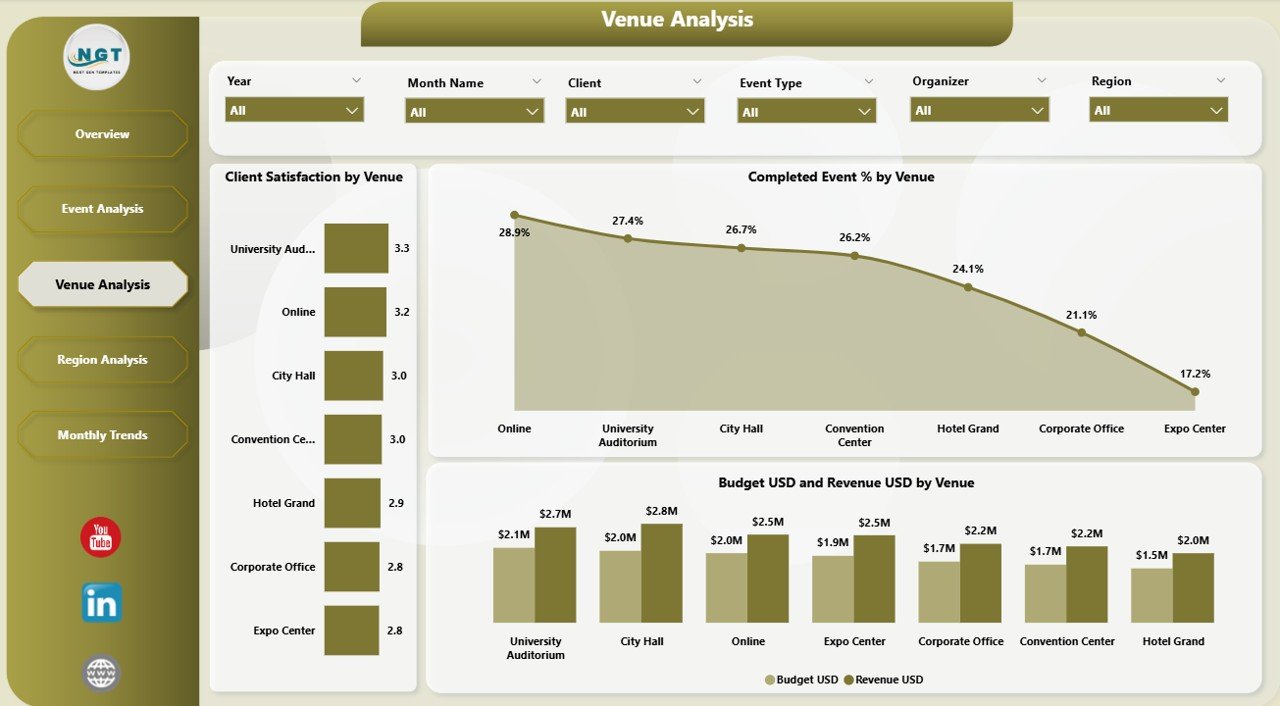
🏢 3️⃣ Venue Analysis Page – Evaluate Venue Performance
Venue choice defines event success — analyze it data-first.
Charts:
-
Client Satisfaction by Venue
-
Completed Event % by Venue
-
Budget (USD) vs Revenue (USD) by Venue
💼 Compare locations to discover which venues drive the highest satisfaction and ROI for future negotiations.
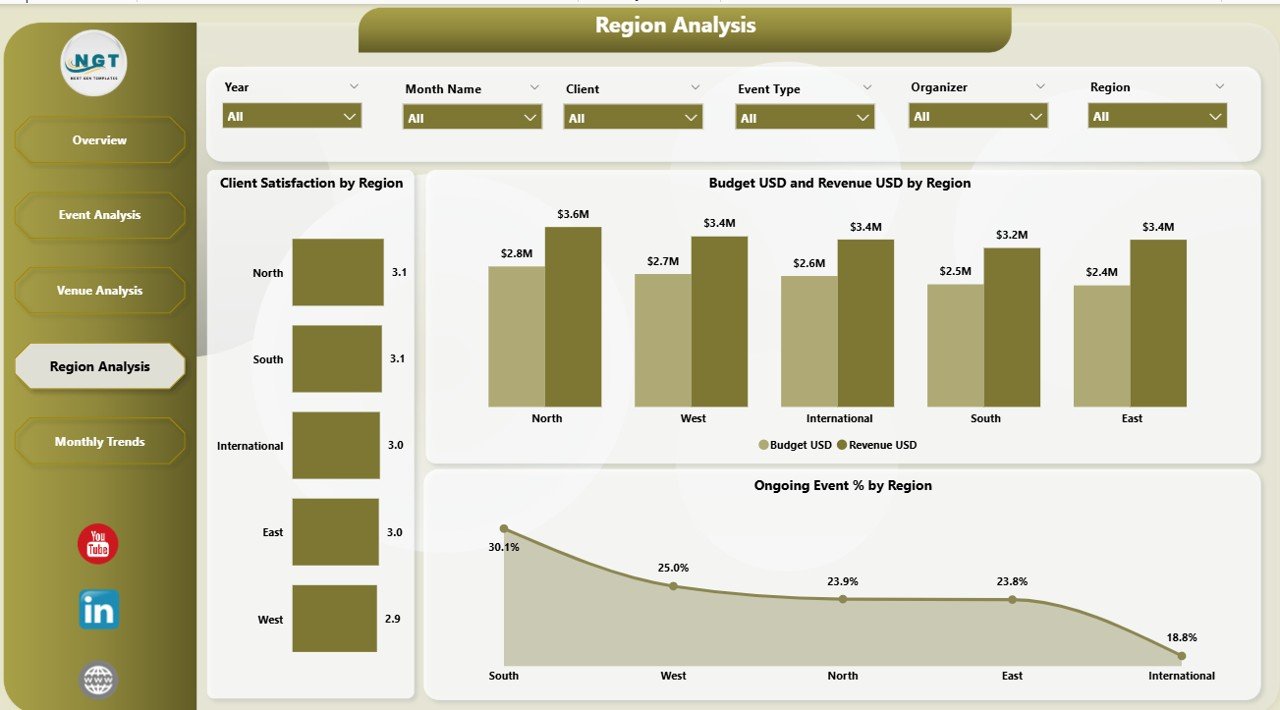
🌍 4️⃣ Region Analysis Page – Track Geographic Performance
For multi-location operations, see how regions stack up.
Includes:
-
Client Satisfaction by Region
-
Budget vs Revenue by Region
-
Ongoing Event % by Region
📊 Spot high-performing regions and identify areas needing improvement.
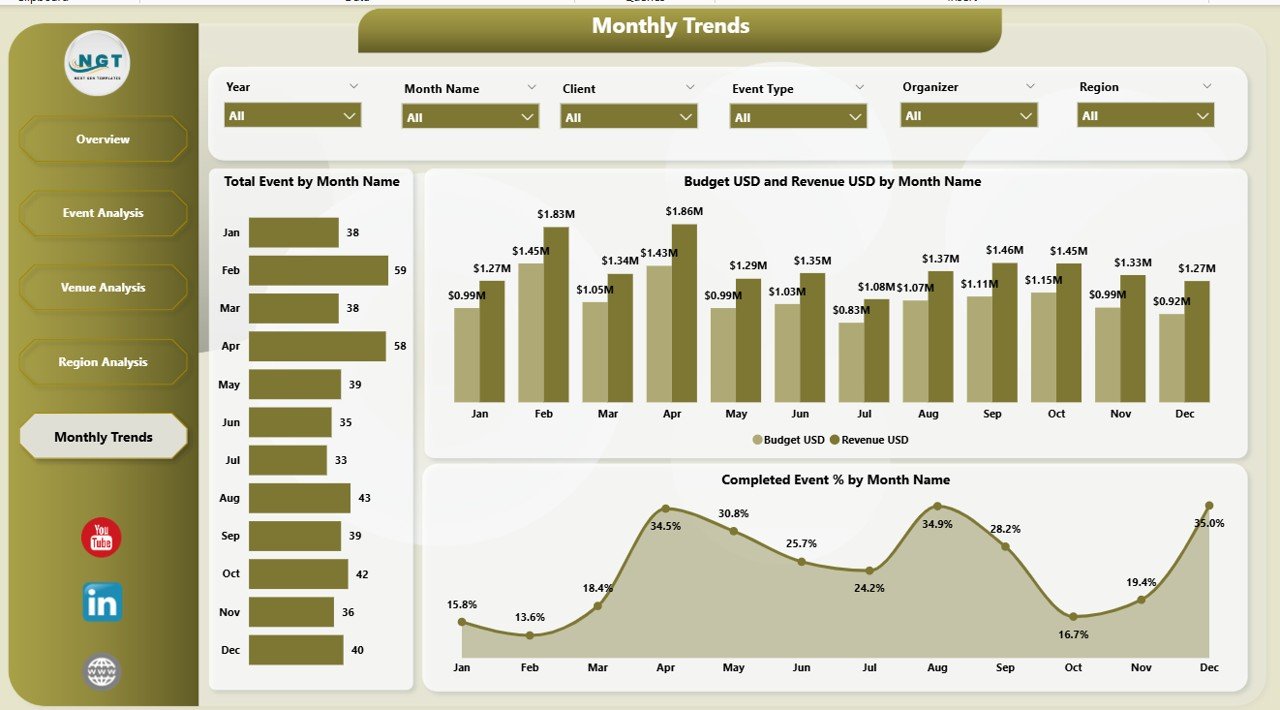
📅 5️⃣ Monthly Trends Page – Plan Ahead with Seasonal Insights
Understand when events peak and how budgets fluctuate.
Visuals:
-
Total Events by Month
-
Budget vs Revenue by Month
-
Completed Event % by Month
📆 Use this data to plan staffing, allocate resources, and forecast upcoming demand accurately.
🌟 Why Choose Power BI for Event Analytics?
✅ Real-Time Data Visualization – Automatically refreshes from Excel or your database.
✅ Interactive Slicers & Drill-Downs – Explore any dimension instantly.
✅ Secure Collaboration – Share with clients or teams through Power BI Service.
✅ Scalable & Flexible – Works for 10 events or 10,000.
✅ No Coding Required – Drag-and-drop visuals with a clean, modern interface.
Power BI turns event reporting into an automated, intuitive experience.
💼 Advantages of Using the Event Management Dashboard in Power BI
-
🧭 Centralized Analytics: All event metrics in one place.
-
⚡ Instant Decision Making: View live performance and financial data.
-
🤝 Enhanced Collaboration: Share dashboards with clients or stakeholders.
-
💰 Financial Visibility: Compare Budget vs Revenue per event type or venue.
-
🎯 Better Client Experience: Track satisfaction % and identify improvement areas.
-
📆 Forecast Readiness: Use monthly trends to predict high-demand periods.
Every KPI, chart, and slicer is designed to give you complete control over event performance.
🧭 Who Can Benefit from This Dashboard?
-
Event Managers & Planners: Track operations and profitability.
-
Marketing Teams: Analyze attendance and satisfaction metrics.
-
Corporate Organizers: Compare event categories across regions.
-
Venue Owners: Monitor booking trends & revenue performance.
-
Finance Departments: Control costs and measure ROI.
Ideal for companies hosting conferences, expos, training sessions, or live events.
🪄 Best Practices for Using the Dashboard
1️⃣ Keep Excel data clean and consistent.
2️⃣ Define clear KPIs – Budget Utilization %, Completion %, Satisfaction %.
3️⃣ Automate refresh schedules in Power BI Service.
4️⃣ Use color-coded indicators for target vs actual comparisons.
5️⃣ Leverage drill-through pages for venue or region details.
6️⃣ Share securely with role-based access permissions.
💡 Follow these steps for precise, reliable, and visually appealing reporting.
🔗 Click here to read the Detailed Blog Post
📺 Visit our YouTube Channel for Step-by-Step Tutorials
👉 YouTube.com/@PKAnExcelExpert


Reviews
There are no reviews yet.