


In a world where sustainability is no longer optional, organizations must track their environmental impact with precision and transparency. 🌍 From carbon emissions and energy usage to waste reduction and compliance with environmental regulations, businesses face pressure from governments, investors, and customers to demonstrate measurable progress.
The Environmental Services KPI Dashboard in Excel is a ready-to-use, structured solution that transforms raw environmental data into actionable insights. By leveraging Excel’s familiar interface, it eliminates the need for costly BI software while still delivering powerful reporting, tracking, and visualization tools. This dashboard empowers decision-makers to monitor performance, identify risks, and implement effective sustainability strategies.
✨ Key Features of Environmental Services KPI Dashboard in Excel
-
🏠 Home Sheet – Acts as a central hub with quick navigation buttons for seamless movement between sheets.
-
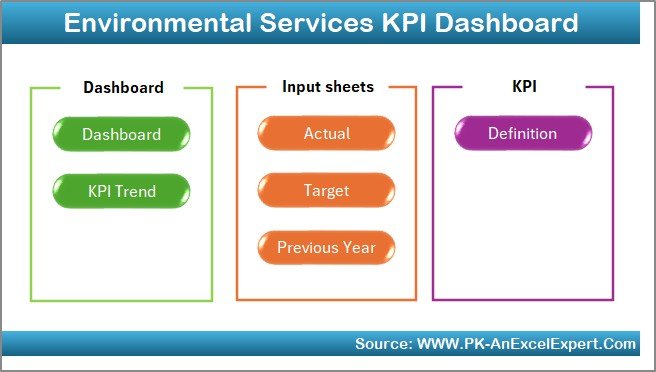
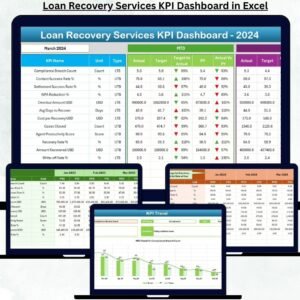
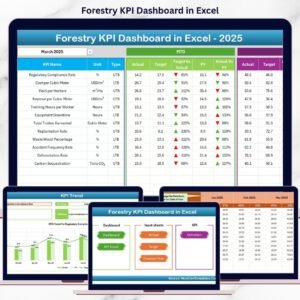
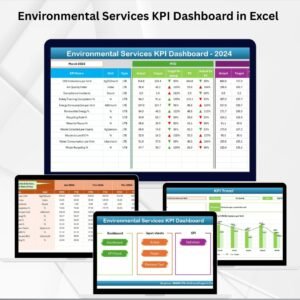
📊 Dashboard Sheet – A comprehensive summary page showing KPIs, MTD (Month-to-Date), YTD (Year-to-Date), targets, and previous year comparisons. Includes visual cues like arrows for quick performance checks.
-
📈 KPI Trend Sheet – Drill into individual KPIs with dropdown selection, trend charts, and definitions. See patterns in monthly and yearly performance.
-
📝 Actual Numbers Input Sheet – Enter real data monthly, with flexibility to adjust the start of the year.
-
🎯 Target Sheet – Record monthly and annual targets for meaningful comparisons.
-
📂 Previous Year Numbers Sheet – Store historical data to track long-term progress.
-
📘 KPI Definition Sheet – Document KPI names, formulas, groups, units, and definitions for consistency and clarity.
📂 What’s Inside the Environmental Services KPI Dashboard
This template comes with seven structured worksheets designed for efficiency and accuracy:
-
Home Sheet – Professional index with six navigation buttons.
-
Dashboard Sheet – High-level view of KPIs vs. targets and previous year values.
-
KPI Trend Sheet – Interactive charts and analysis for each KPI.
-
Actual Numbers Input Sheet – Monthly input form for real performance data.
-
Target Sheet – Capture planned values and goals.
-
Previous Year Numbers Sheet – Enable year-over-year comparisons.
-
KPI Definition Sheet – A complete KPI library to guide reporting.
🛠 How to Use the Environmental Services KPI Dashboard
-
Enter Data – Record actual monthly performance in the input sheet.
-
Set Targets – Define monthly and annual sustainability goals.
-
Load Previous Year Data – Add last year’s figures for comparison.
-
Review Dashboard – Navigate to the dashboard sheet for instant performance summaries.
-
Analyze Trends – Use the KPI Trend Sheet to identify long-term progress and seasonal changes.
-
Communicate Results – Share insights with stakeholders for accountability and reporting.
👥 Who Can Benefit from This Dashboard
The Environmental Services KPI Dashboard in Excel is perfect for:
-
🏭 Manufacturing Plants – Monitor emissions, waste, and resource usage.
-
🏢 Corporate Offices – Track electricity, water, and paper consumption.
-
🏥 Healthcare Facilities – Ensure compliance with medical waste regulations.
-
🎓 Educational Institutions – Promote sustainability through energy and recycling initiatives.
-
🌍 Sustainability Teams & Compliance Officers – Provide audit-ready reports and performance insights.


Reviews
There are no reviews yet.