Environmental performance is no longer optional—it is a strategic priority. Organizations today must track energy usage, emissions, waste, compliance, and sustainability targets consistently. However, many teams still rely on scattered spreadsheets, manual calculations, or static reports. As a result, visibility remains low, trends stay hidden, and corrective actions arrive too late.
That is exactly where the Environmental KPI Scorecard in Google Sheets delivers real value.
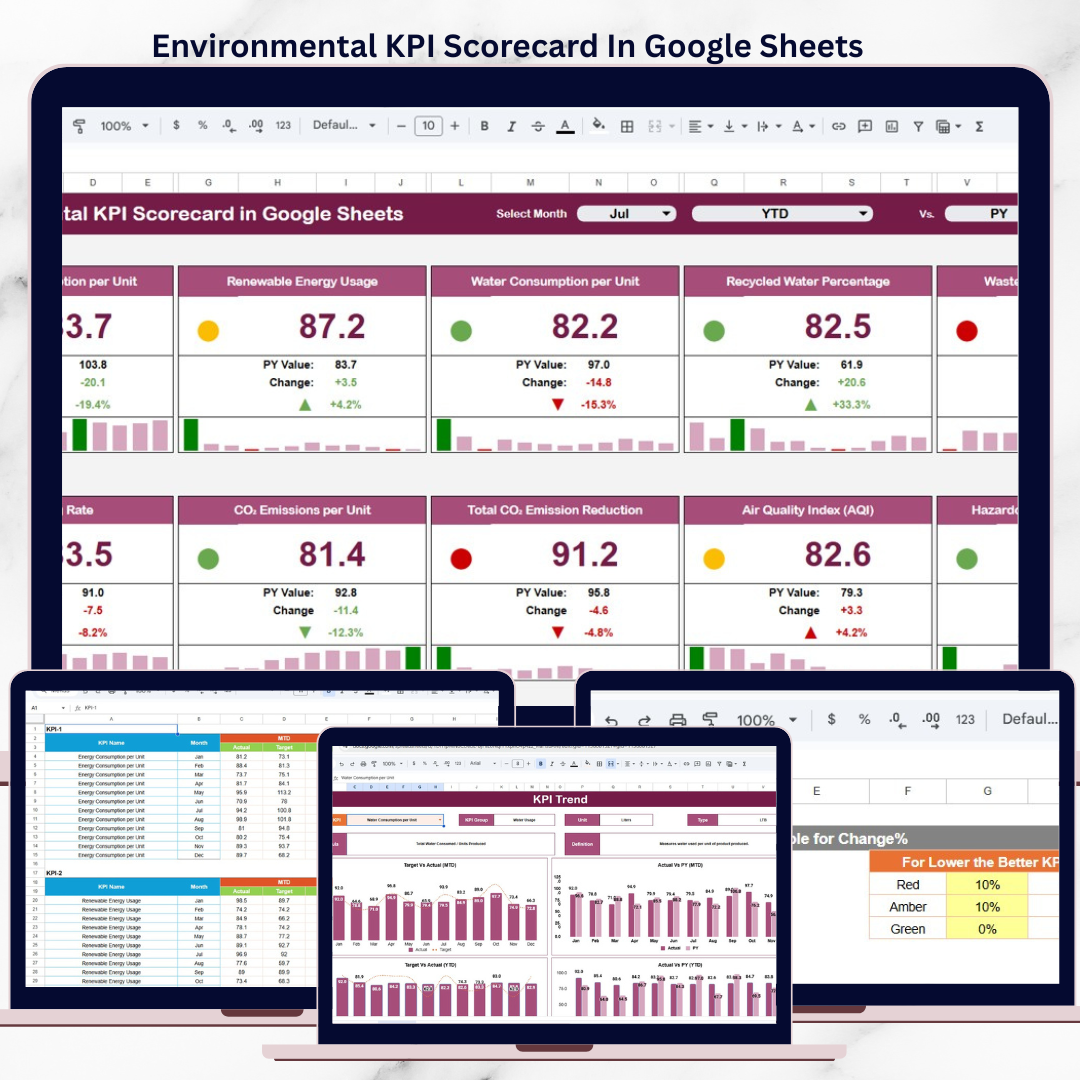
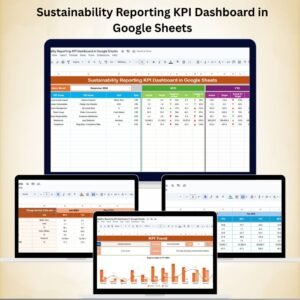
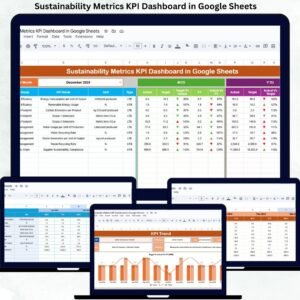
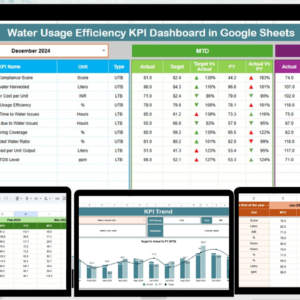
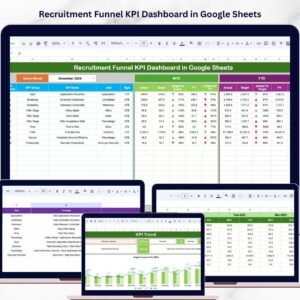
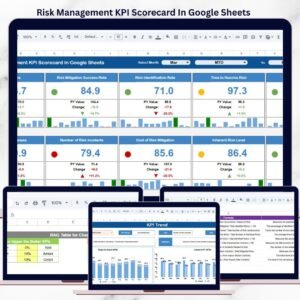
This ready-to-use scorecard helps organizations monitor environmental KPIs clearly, visually, and consistently. Instead of spending hours preparing reports, sustainability and ESG teams gain instant insights using traffic lights, trend arrows, and MTD/YTD views—all inside Google Sheets.
Because it is cloud-based, teams collaborate in real time and always work with the latest data.
⭐ Key Features of Environmental KPI Scorecard in Google Sheets
🌍 Centralized Environmental KPI Tracking
Monitor all sustainability KPIs in one structured scorecard.
📅 Month Selection Drop-Down
Select any reporting month and see the entire scorecard update instantly.
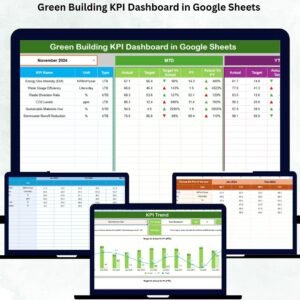
📊 MTD & YTD Performance Views
Analyze monthly performance and cumulative yearly progress easily.
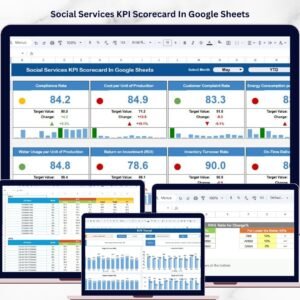
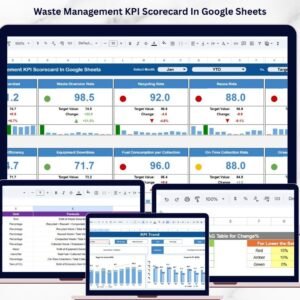
🚦 Traffic Light Indicators (RAG)
Instantly identify KPIs that are on track, at risk, or underperforming.
📈 Up & Down Trend Arrows
Understand percentage change and performance movement at a glance.
📘 Clear KPI Definitions
Each KPI includes unit, formula, definition, and performance direction.
🧩 Fully Customizable Template
Modify KPIs, thresholds, and colors without touching complex formulas.
☁️ Built in Google Sheets
Real-time collaboration, cloud access, and easy sharing.
📦 What’s Inside the Environmental KPI Scorecard in Google Sheets?
This scorecard includes multiple well-structured sheets, each serving a clear purpose:
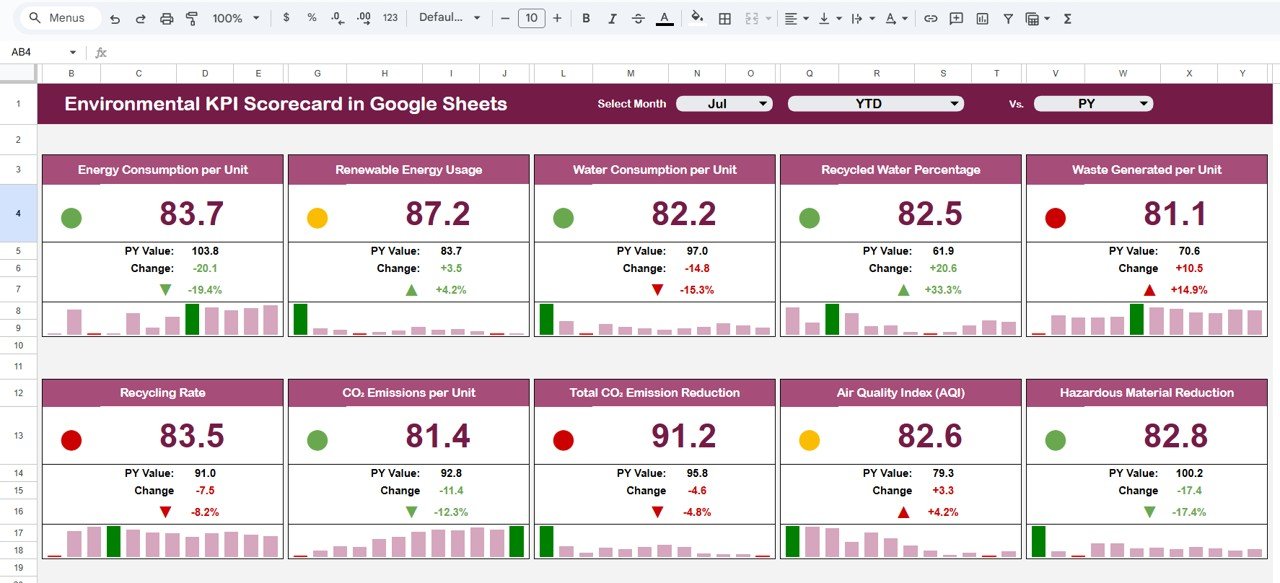
📌 Scorecard Sheet
The main dashboard showing 10 environmental KPIs with actual vs target comparison, traffic lights, arrows, and MTD/YTD toggle.
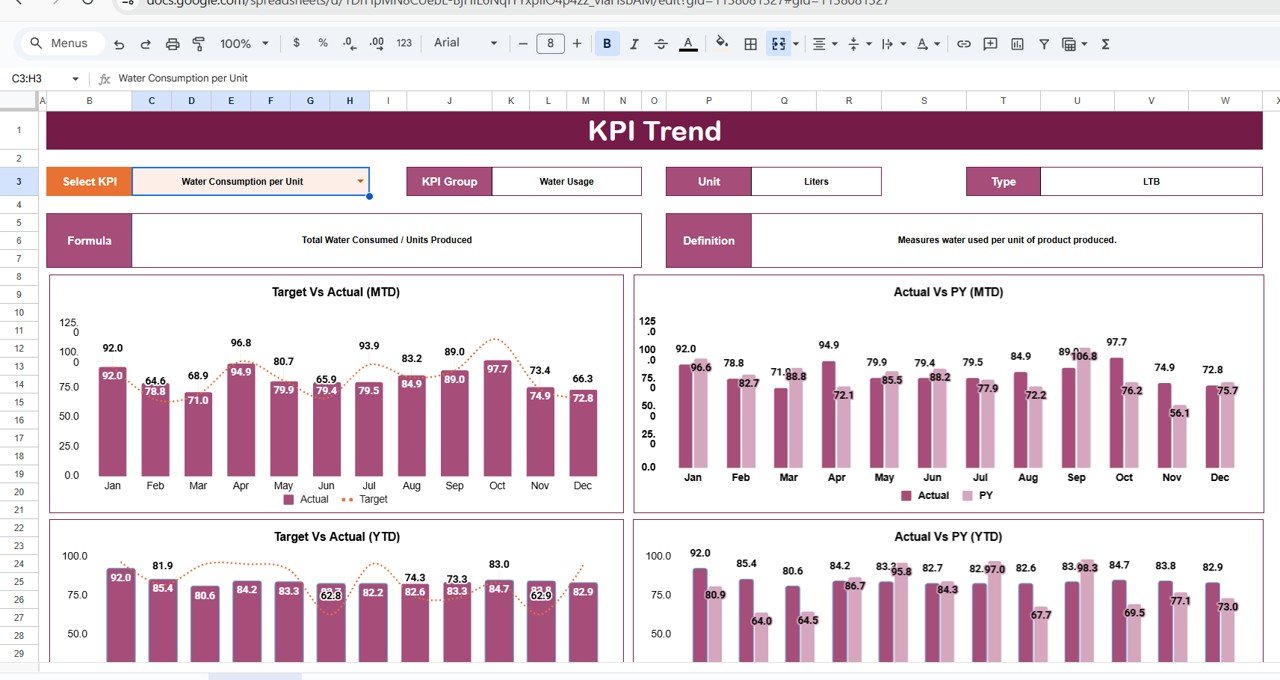
📌 Trend Sheet
KPI-wise trend analysis with KPI group, unit, type (LTB/UTB), and visual trend movement.
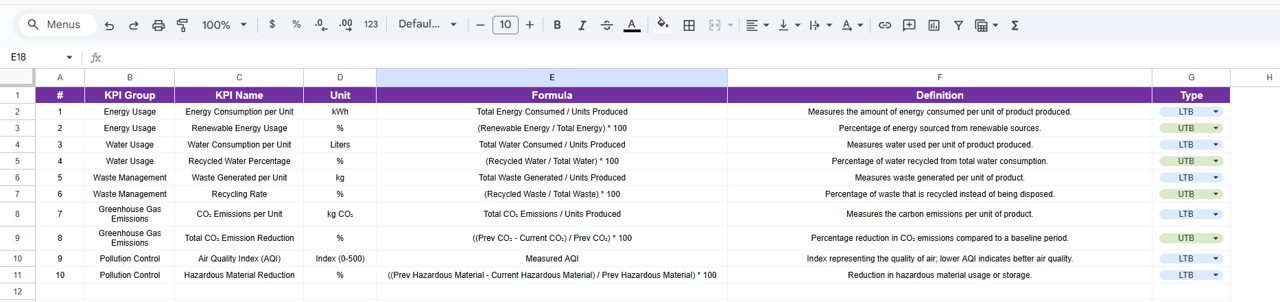
📌 KPI Definition Sheet
Central reference for KPI name, group, unit, formula, and definition.
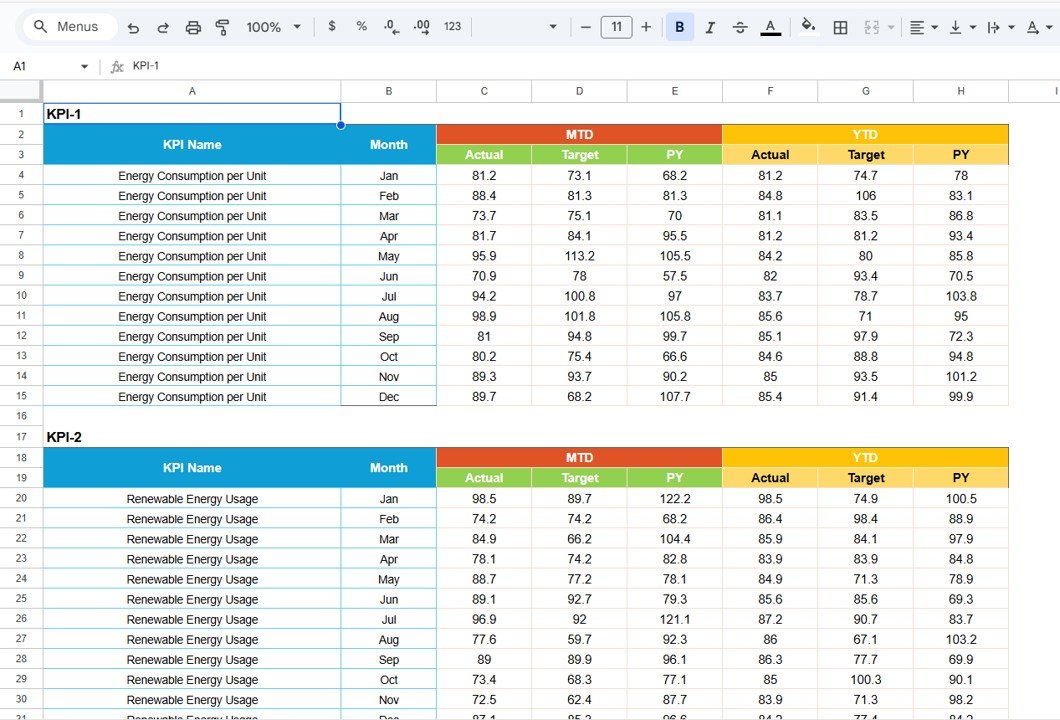
📌 Data Input Sheet
Simple and structured sheet for monthly environmental data entry.
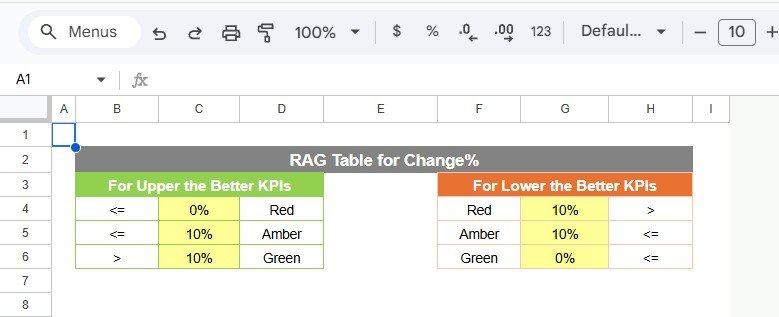
📌 Colour Settings Sheet
Controls traffic light thresholds, arrow logic, and indicator colors.
Together, these sheets form a complete environmental performance monitoring system.
🛠️ How to Use the Environmental KPI Scorecard in Google Sheets
Using this scorecard is quick and user-friendly:
1️⃣ Enter environmental data in the Data Input Sheet
2️⃣ Define or review KPIs in the KPI Definition Sheet
3️⃣ Select the reporting month from the drop-down
4️⃣ Switch between MTD and YTD views
5️⃣ Review traffic lights, arrows, and trends
6️⃣ Take action on underperforming KPIs
All calculations and visuals update automatically, so users focus on insights—not formulas.
👥 Who Can Benefit from This Environmental KPI Scorecard?
This scorecard is ideal for:
🌱 Sustainability & ESG Teams
🏭 Manufacturing & Industrial Companies
📋 Environmental Compliance Officers
🏢 Corporate ESG Reporting Teams
📊 Consultants & Auditors
🌍 Organizations tracking sustainability goals
Whether you manage internal sustainability KPIs or external ESG reporting, this scorecard fits perfectly.
🚀 Why This Scorecard Is a Must-Have for Environmental Tracking
✔ Centralizes all environmental KPIs
✔ Improves visibility of sustainability performance
✔ Highlights issues instantly with visuals
✔ Reduces manual reporting effort
✔ Supports data-driven environmental decisions
✔ No expensive BI tools required
This scorecard transforms Google Sheets into a powerful environmental performance management tool.
🔗 Click here to read the Detailed blog post
Watch the step-by-step video tutorial:
📺 Visit our YouTube channel to learn step-by-step video tutorials and scorecard walkthroughs.


Reviews
There are no reviews yet.