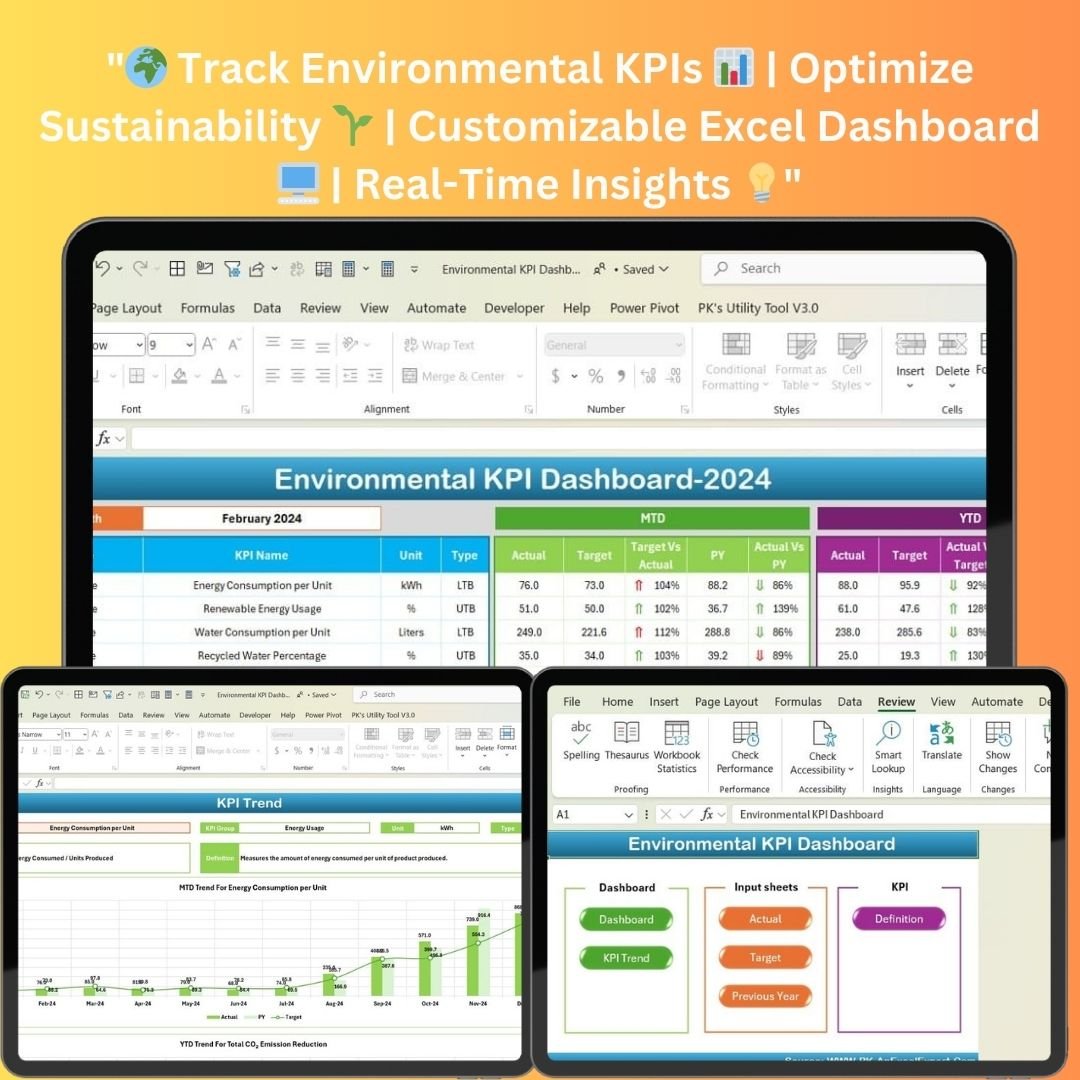


The Environmental KPI Dashboard in Excel is a highly efficient tool designed to help organizations track, monitor, and analyze their environmental performance. This dashboard allows businesses to measure sustainability metrics, including energy usage, water consumption, waste management, and greenhouse gas emissions. By providing a centralized, real-time overview of your key performance indicators (KPIs), the dashboard makes it easier to manage environmental goals and ensure compliance with sustainability targets.
Whether you are tracking energy consumption or monitoring waste reduction efforts, this Excel dashboard simplifies the process of evaluating your environmental impact and making data-driven decisions for improvement. It offers a user-friendly interface, flexible data entry, and powerful analysis capabilities, all in one streamlined platform.
Key Features
1. Home Sheet – Easy Navigation
The Home Sheet serves as the central hub for navigating the entire dashboard. This user-friendly index provides quick access to all other sheets in the workbook, allowing you to jump directly to the data you need. With a clean, organized layout, users can effortlessly navigate between the KPI Overview, Trend Analysis, Data Entry, and Definitions sections.

2. Dashboard Sheet – Real-Time Performance Summary
The Dashboard Sheet is the main overview page, designed to provide a quick snapshot of your organization’s environmental performance. This sheet displays both monthly and yearly KPI summaries, using conditional formatting to highlight how current performance compares to set targets and previous year values. With visual indicators like color-coded cells and charts, you can easily track performance and identify areas requiring attention.

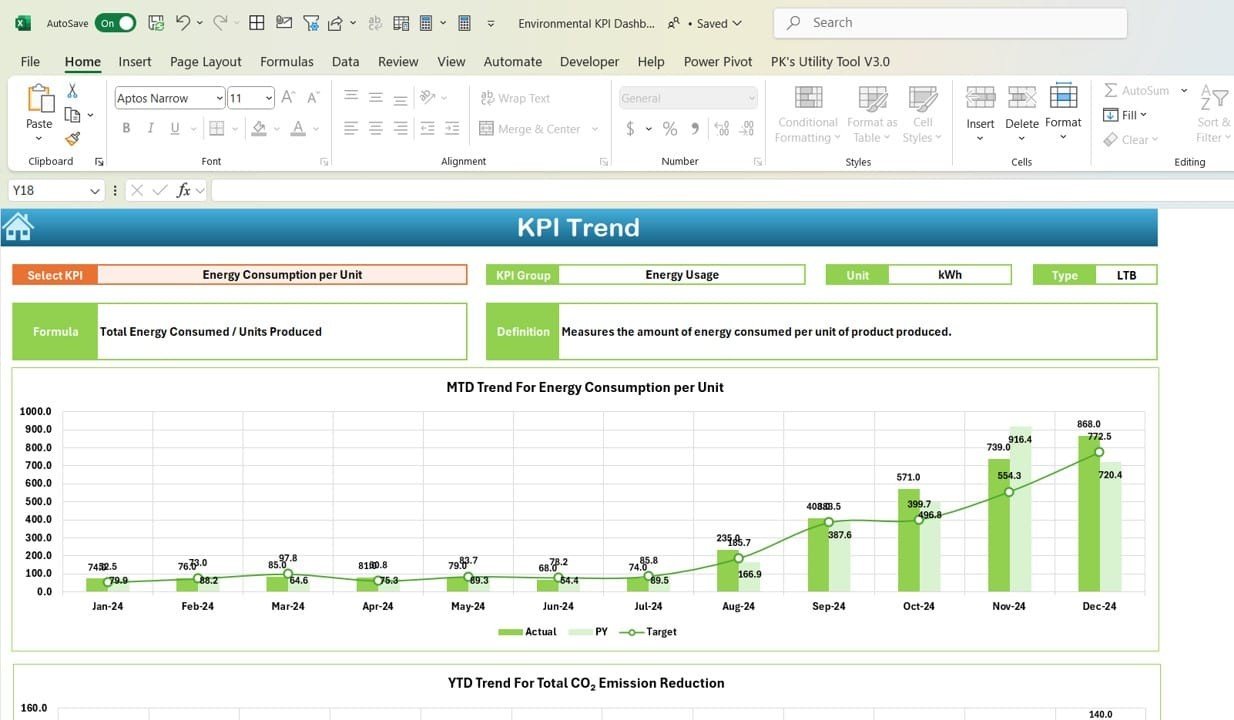
3. KPI Trend Sheet – Historical Insights
The KPI Trend Sheet offers a deeper analysis of trends over time. This sheet includes Month-to-Date (MTD) and Year-to-Date (YTD) performance data for each KPI, accompanied by trend charts that illustrate how your metrics have evolved. The trend analysis feature allows you to select specific KPIs and view their progress in a visually engaging format. This makes it easier to spot positive or negative trends and adjust your sustainability strategies accordingly.
4. Actual Numbers Input Sheet – Easy Data Entry
The Actual Numbers Input Sheet provides a dedicated area for entering Month-to-Date (MTD) and Year-to-Date (YTD) actual performance data. It is organized by month, ensuring that all data is updated regularly. With clear instructions and easily identifiable fields, this sheet simplifies the data entry process, so you can quickly update your metrics and see the latest performance results.
5. Target Sheet – Goal Setting and Tracking
The Target Sheet is essential for setting monthly and yearly goals for each KPI. You can input targets for various environmental metrics such as energy usage, water consumption, waste generation, and emissions. This sheet supports goal tracking by comparing actual performance against set targets, allowing you to assess whether your organization is on track to meet its sustainability objectives.
6. Previous Year Data Sheet – Year-Over-Year Comparison
The Previous Year Data Sheet enables you to input historical data from the previous year for comparison purposes. By comparing current year performance with previous year results, you can evaluate the effectiveness of your sustainability initiatives and see where improvements are needed. This year-over-year analysis is crucial for measuring progress and identifying long-term trends.
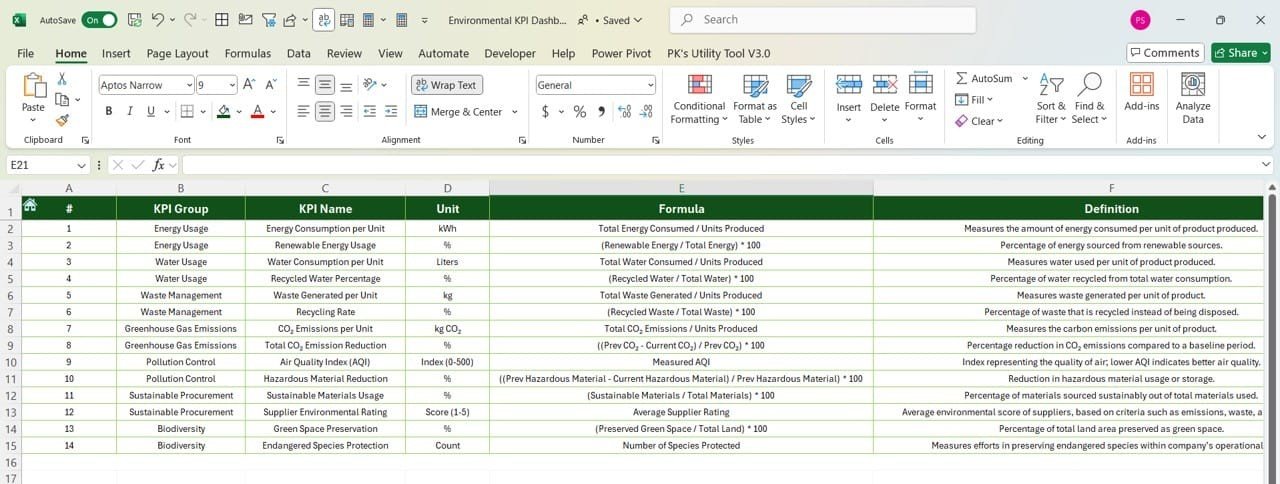
7. KPI Definition Sheet – Clear KPI Reference
The KPI Definition Sheet serves as a comprehensive reference guide for understanding each KPI in detail. This sheet includes the name, unit, formula, and a clear definition for every KPI, ensuring users can easily interpret their data. Whether you’re measuring energy consumption, waste reduction, or greenhouse gas emissions, this sheet provides all the information you need to understand the metrics and how they relate to your environmental goals.
Benefits of the Environmental KPI Dashboard in Excel
- Centralized Data Management: Consolidate all your environmental KPIs in one place for easier monitoring and management.
- Real-Time Tracking: Monitor MTD and YTD progress in real-time and compare against targets and previous year performance.
- Goal-Oriented: Set specific environmental targets and track your progress towards meeting them.
- Trend Analysis: Analyze historical trends to identify patterns and adjust your strategies accordingly.
- Improved Decision Making: Make data-driven decisions to optimize environmental sustainability practices.
- User-Friendly Interface: No need for advanced technical skills to navigate or use this dashboard.
- Easy Customization: Tailor the dashboard to fit your specific environmental goals, whether you’re tracking energy, water, or emissions.
Who Should Use This Dashboard?
This dashboard is designed for organizations of all sizes, particularly those with a focus on improving environmental sustainability. It is ideal for corporate sustainability teams, environmental management departments, facility managers, and compliance officers in industries such as manufacturing, utilities, construction, and waste management. Whether you are a small business or a large enterprise, this tool will help streamline your environmental reporting and performance monitoring efforts.
Compatibility
- Excel Version: Compatible with Excel 2016 and later versions, including Excel 365.
- Operating System: Works seamlessly on both Windows and macOS.
Why Choose the Environmental KPI Dashboard in Excel?
This Excel dashboard provides the flexibility, functionality, and ease of use that organizations need to monitor and manage their environmental impact effectively. With its intuitive design and comprehensive features, the Environmental KPI Dashboard in Excel makes it easy to track performance, set goals, and make adjustments for continuous improvement. It’s an essential tool for any organization committed to sustainability and environmental responsibility.
Get Started Today
Take charge of your environmental performance by purchasing the Environmental KPI Dashboard in Excel today. With instant access to the file, you’ll be up and running in no time, monitoring and optimizing your organization’s sustainability effort
Click here to read the detailed blog post
Visit our YouTube channel to learn step-by-step video tutorials


Reviews
There are no reviews yet.