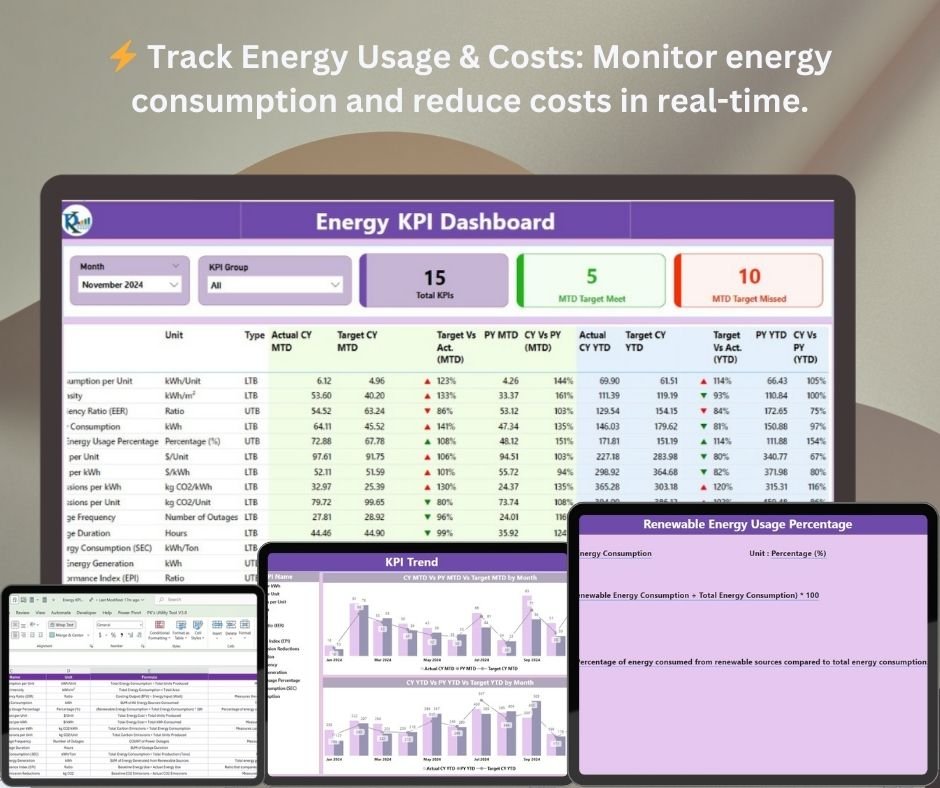


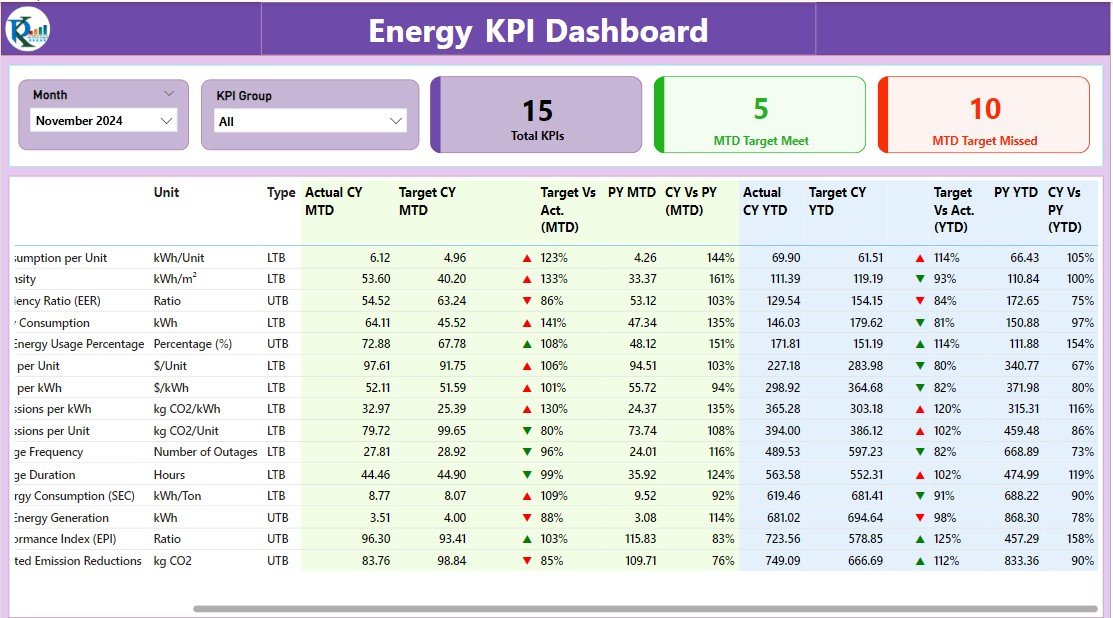
The Energy KPI Dashboard in Power BI is a powerful tool designed for businesses, energy managers, and sustainability professionals to monitor and optimize energy consumption. This interactive, real-time dashboard allows you to track key performance indicators (KPIs) such as energy usage, cost savings, carbon footprint, and efficiency. It enables organizations to make data-driven decisions that improve energy efficiency, reduce operational costs, and ensure sustainability.
Whether you’re tracking energy consumption across multiple locations, optimizing energy use in manufacturing processes, or managing sustainability goals, the Energy KPI Dashboard in Power BI provides the insights you need to take action. By visualizing energy data in real time, this tool helps organizations achieve their energy-saving goals and minimize their environmental impact.
Key Features of the Energy KPI Dashboard in Power BI
⚡ Track Energy Consumption & Cost
Monitor energy usage across various departments, locations, or facilities. The dashboard helps you identify energy consumption patterns and provides insights into where you can reduce energy usage and associated costs.
💡 Energy Efficiency Monitoring
Track the efficiency of your energy systems, processes, and operations. Evaluate energy consumption per unit of output or per facility to optimize performance and reduce waste.
📉 Carbon Footprint & Environmental Impact
Measure and track your organization’s carbon emissions and environmental impact. Monitor the effectiveness of sustainability initiatives and assess how energy consumption contributes to your overall carbon footprint.
💰 Cost Savings Analysis
Evaluate the financial impact of energy usage by tracking cost savings over time. Identify areas where energy-saving initiatives have been successful and where further savings can be achieved.
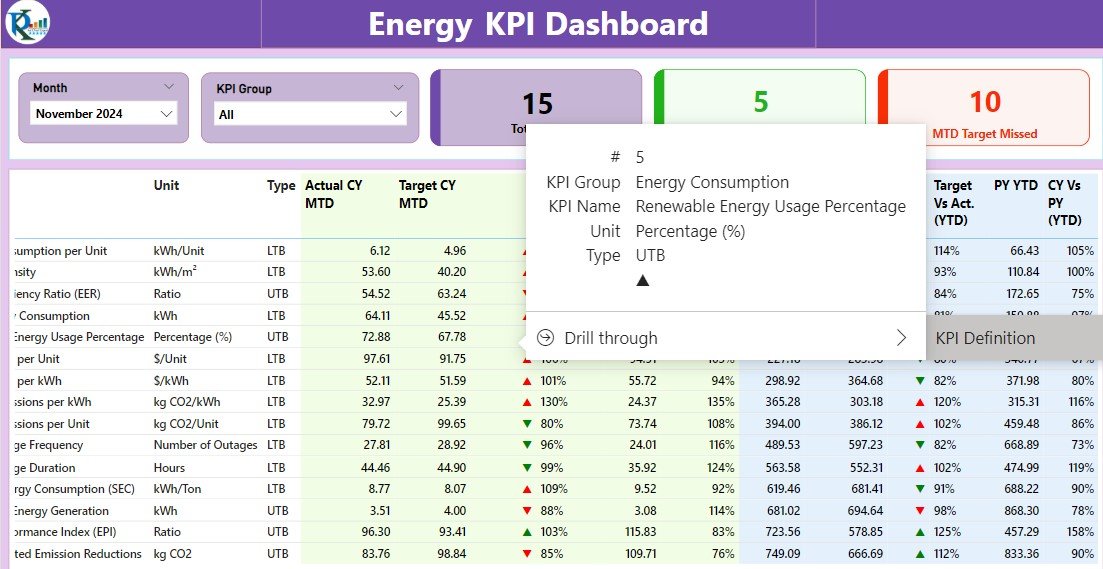
🖥️ Interactive & Real-Time Insights
Gain real-time updates on all key energy KPIs. The Power BI dashboard provides dynamic charts, filters, and slicers for deep insights and detailed analysis of energy data across multiple parameters.
Why You’ll Love the Energy KPI Dashboard in Power BI
✅ Monitor Energy Usage & Costs in Real-Time
Track energy consumption and associated costs in real-time. Identify high energy usage areas and make timely adjustments to optimize consumption and reduce costs.
✅ Improve Energy Efficiency
Track energy performance across various departments or locations. Use insights from the dashboard to optimize energy efficiency and improve performance across the organization.
✅ Measure Sustainability & Carbon Footprint
Monitor your organization’s carbon emissions and overall environmental impact. Use the dashboard to track the success of sustainability initiatives and adjust strategies as needed to reduce carbon footprints.
✅ Track Financial Impact of Energy Usage
Measure the financial savings and benefits achieved through energy-saving initiatives. Track energy cost savings and evaluate the ROI of sustainability measures.
✅ Data-Driven Decision Making
Use the insights from the dashboard to make informed decisions that drive energy efficiency, sustainability, and cost savings. Leverage real-time data to optimize energy consumption and meet organizational goals.
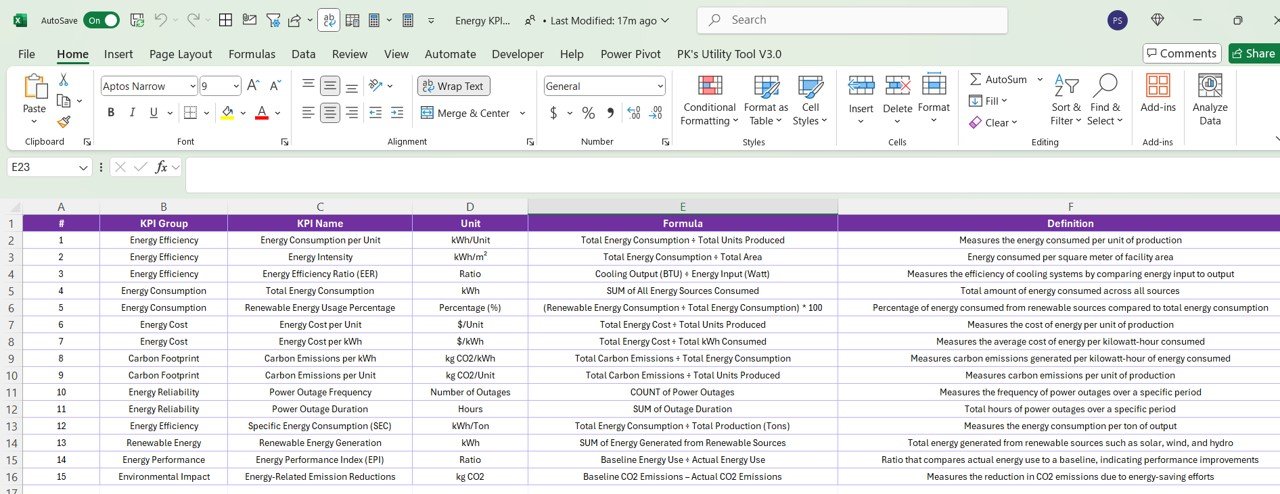
What’s Inside the Energy KPI Dashboard Template?
- Energy Consumption & Cost Tracking: Track energy usage and associated costs across various departments or facilities.
- Energy Efficiency Monitoring: Evaluate energy efficiency and identify opportunities for optimization.
- Carbon Footprint Tracking: Monitor and track carbon emissions to assess sustainability efforts.
- Cost Savings & Financial Impact: Measure financial savings from energy-saving initiatives and track ROI.
- Real-Time Insights: Stay updated with real-time energy consumption and performance data.
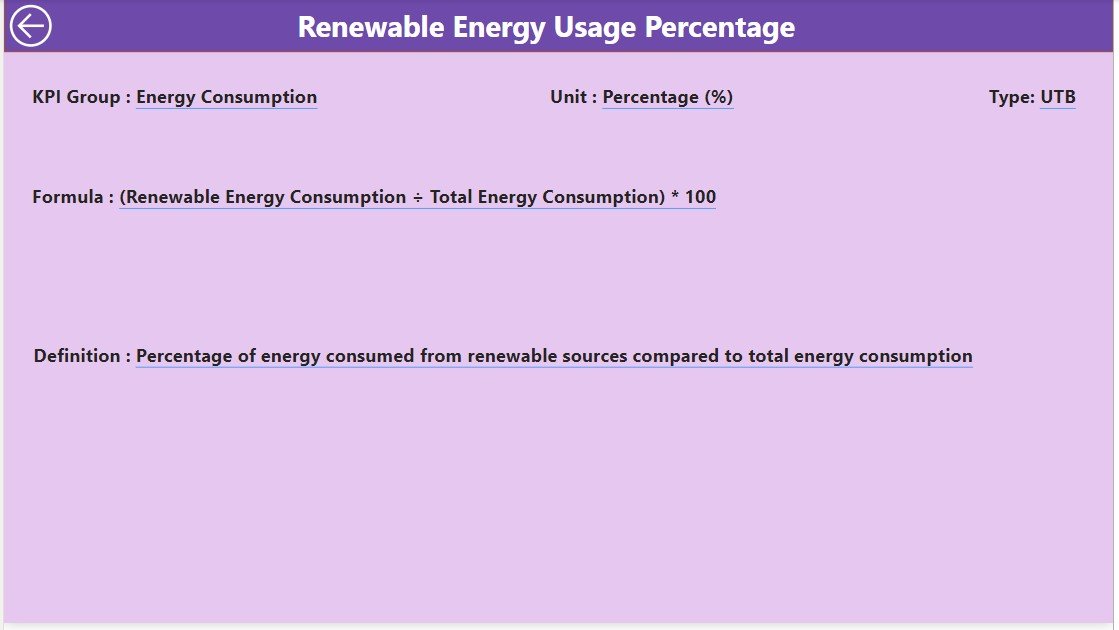
- Customizable KPIs: Adjust the dashboard to track energy metrics that are important to your business goals.
How to Use the Energy KPI Dashboard in Power BI
1️⃣ Download the Template: Get instant access to your Energy KPI Dashboard in Power BI.
2️⃣ Input Your Data: Enter energy consumption, cost, carbon footprint, and savings data into the dashboard.
3️⃣ Track & Monitor KPIs: Use the dashboard to monitor your energy usage, efficiency, costs, and environmental impact in real time.
4️⃣ Analyze & Optimize: Use insights to optimize energy consumption, reduce costs, and improve sustainability.
Who Can Benefit from the Energy KPI Dashboard in Power BI?
🔹 Energy Managers & Sustainability Professionals
🔹 Operations & Facilities Managers
🔹 Corporate Social Responsibility (CSR) Teams
🔹 Environmental Consultants
🔹 Business Owners & Executives Focused on Sustainability
🔹 Anyone Looking to Optimize Energy Usage & Improve Sustainability
Optimize your energy consumption, reduce costs, and improve sustainability with the Energy KPI Dashboard in Power BI. Track key energy metrics like usage, cost savings, and carbon footprint to enhance your organization’s performance and sustainability goals.
Click here to read the Detailed blog post
Visit our YouTube channel to learn step-by-step video tutorials
Youtube.com/@PKAnExcelExpert


Reviews
There are no reviews yet.