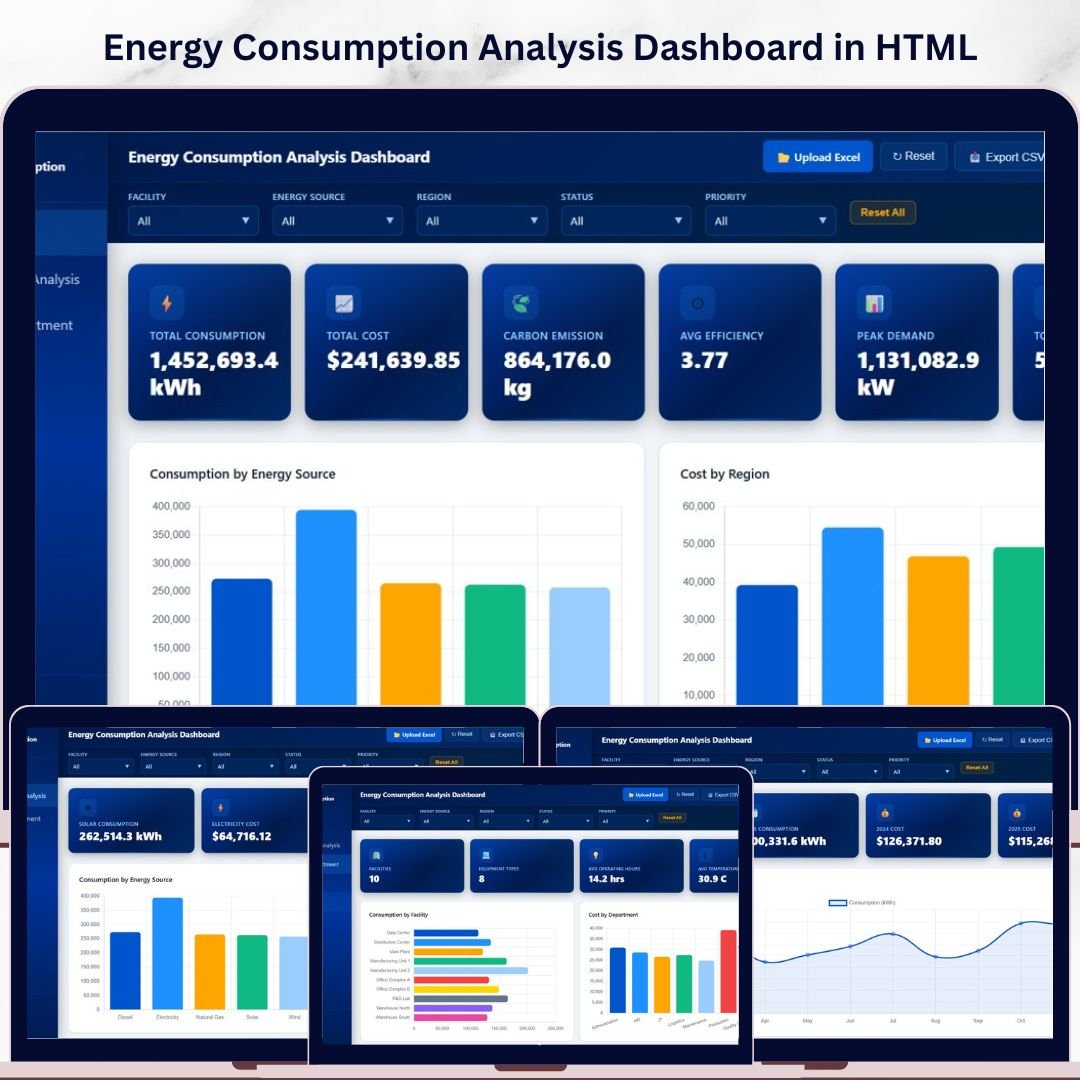
Energy Consumption Analysis Dashboard in HTML is a comprehensive, browser-based analytics solution built for energy managers, facility operators, sustainability officers, and operations teams who need to monitor energy consumption, costs, carbon emissions, and efficiency metrics — all from one sleek, interactive dashboard. This ready-to-use HTML dashboard template includes 5 interactive pages covering Overview, Energy Source Analysis, Facility and Department breakdown, Time Analysis, and a detailed Data View — giving you complete visibility into your organization’s energy footprint 🚀.
🔑 Key Features of Energy Consumption Analysis Dashboard in HTML
⚡ 5 Interactive Dashboard Pages – Explore energy data across Overview, Energy Source Analysis, Facility and Department, Time Analysis, and Data View — each designed for a specific analytical perspective.
📊 Dynamic KPI Cards – Instantly monitor Total Consumption, Total Cost, Carbon Emission, Avg Efficiency, Peak Demand, and Total Records at a glance from the overview page.
🔍 Advanced Slicers and Filters – Filter the entire dashboard by energy source, region, department, status, and more with a single click for targeted energy analytics.
🌿 Carbon Emission Tracking – Track carbon emissions by department and energy source to support sustainability reporting and environmental compliance goals.
📈 Time-Based Trend Analysis – Analyze monthly consumption trends, cost trends, carbon emission patterns, and year-over-year consumption comparisons to identify seasonal patterns and anomalies.
🏢 Facility and Department Breakdown – Compare consumption, costs, and emissions across facilities, departments, and equipment types for granular operational insights.
📋 Detailed Data View Table – Access all energy records with search, sort, pagination, and CSV export functionality for deep data exploration.
🎨 Professional Visual Design – Clean, modern chart layouts with consistent color themes that make presenting findings to stakeholders effortless and impactful.
📦 What’s Inside the Energy Consumption Analysis Dashboard in HTML
This dashboard template includes 5 powerful analytical pages designed to provide comprehensive energy consumption insights:
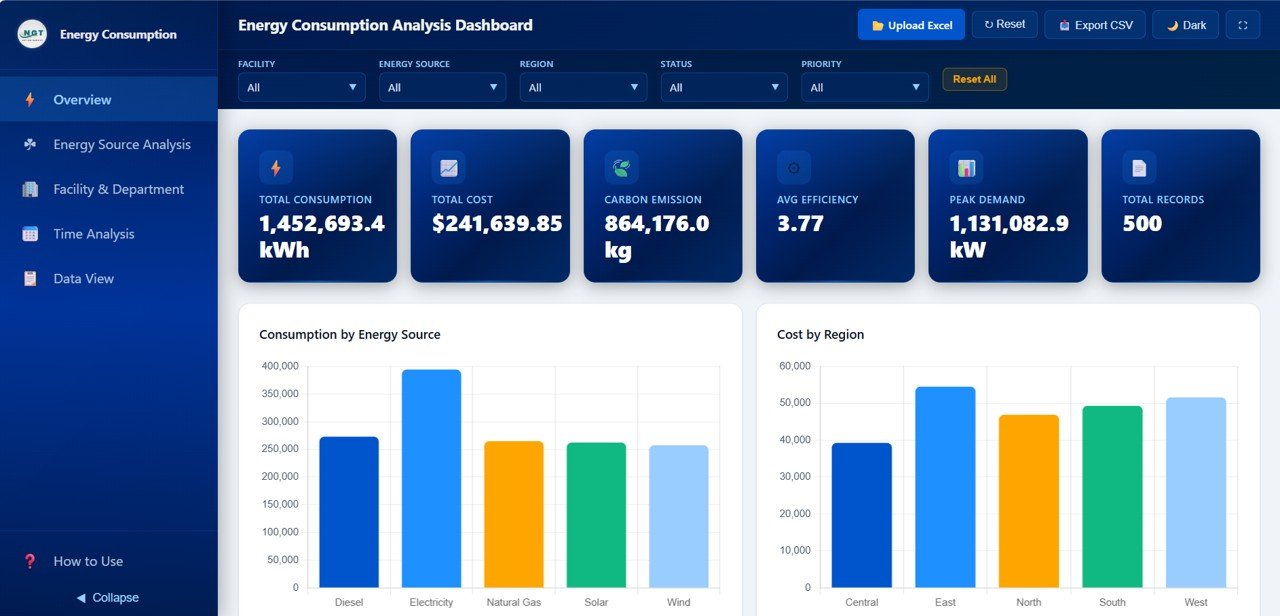
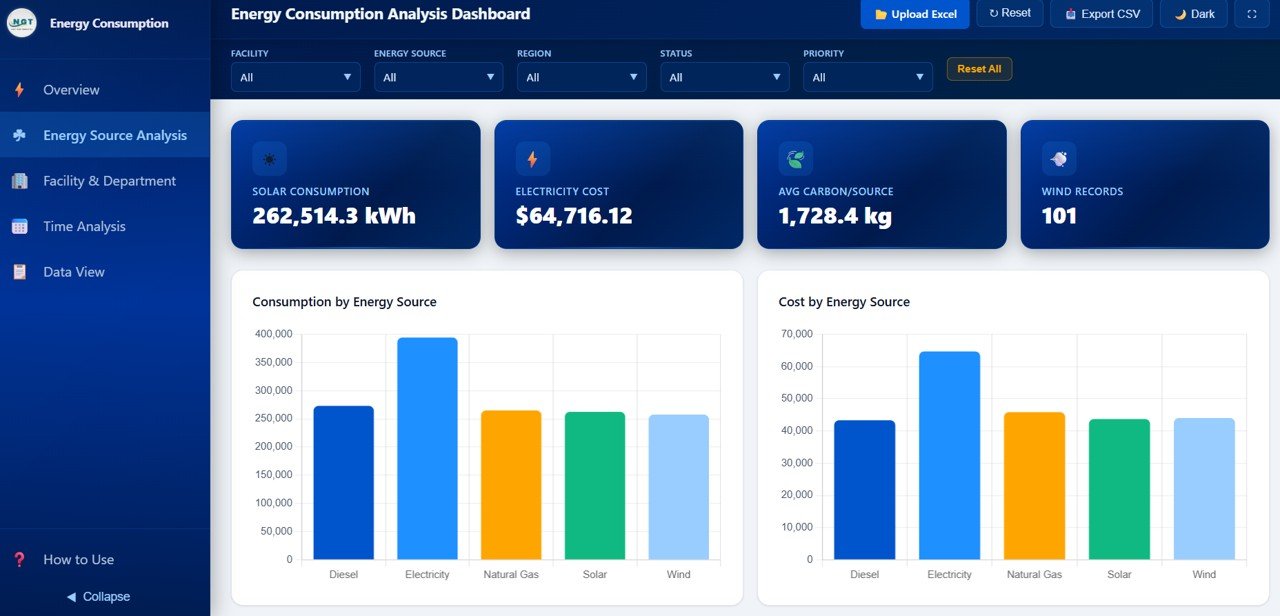
📊 Page 1 – Overview Page
Your command center for energy monitoring. At the top, dynamic KPI cards display Total Consumption, Total Cost, Carbon Emission, Avg Efficiency, Peak Demand, and Total Records. Below, interactive charts present Consumption by Energy Source showing distribution across fuel types, Cost by Region highlighting regional spending patterns, Carbon Emission by Department revealing departmental environmental impact, and Status Distribution breaking down operational status categories. Multiple slicers let you filter and explore the dashboard instantly.
Energy Consumption Analysis Dashboard – Overview
⚡ Page 2 – Energy Source Analysis
Dive deep into energy source performance with charts for Consumption by Energy Source comparing usage across fuel types, Cost by Energy Source revealing spending efficiency by source, Carbon Emission by Energy Source tracking environmental impact per fuel type, Efficiency Rating by Energy Source benchmarking performance across sources, and Peak Demand by Energy Source and Region analyzing demand patterns. Explore our Construction Dashboard in HTML for more infrastructure analytics solutions.
Energy Source Analysis
🏢 Page 3 – Facility and Department
Analyze operational performance with charts for Consumption by Facility comparing usage across locations, Cost by Department revealing departmental spending patterns, Carbon Emission by Facility tracking environmental footprint per site, Equipment Type by Consumption identifying high-consumption equipment categories, and Maintenance Status by Department monitoring equipment health across teams.
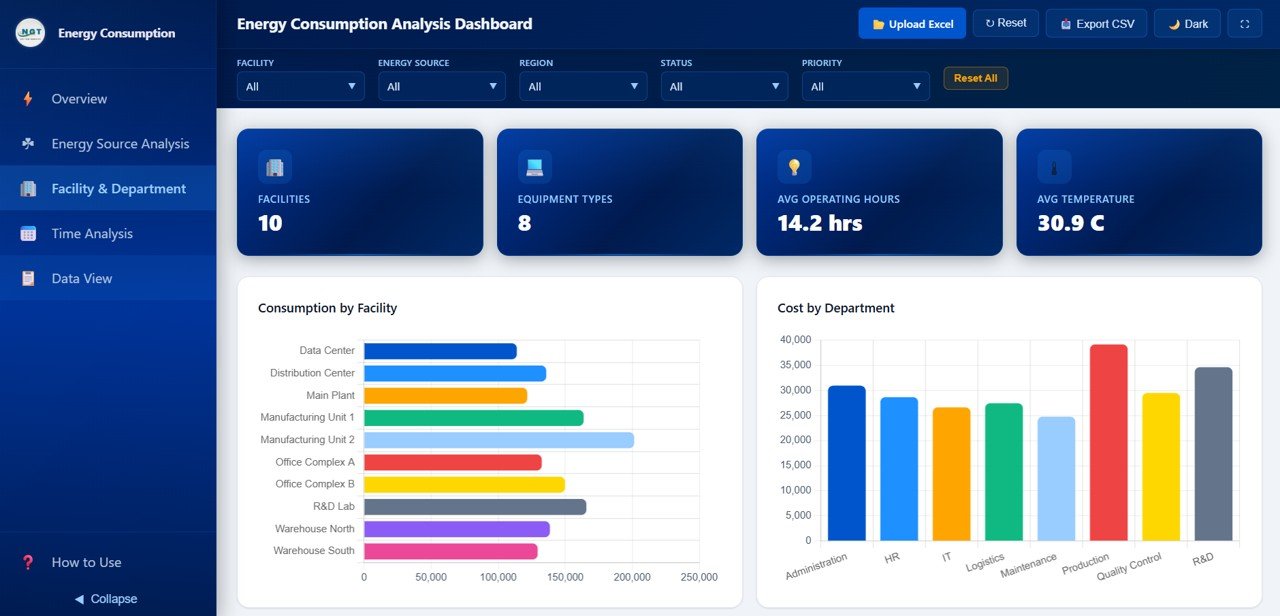
Facility and Department
📅 Page 4 – Time Analysis
Track energy performance over time with charts for Monthly Consumption Trend monitoring usage patterns month by month, Monthly Cost Trend tracking spending evolution, Monthly Carbon Emission analyzing environmental impact trends, and Year over Year Consumption Comparison benchmarking current performance against historical data for strategic planning.
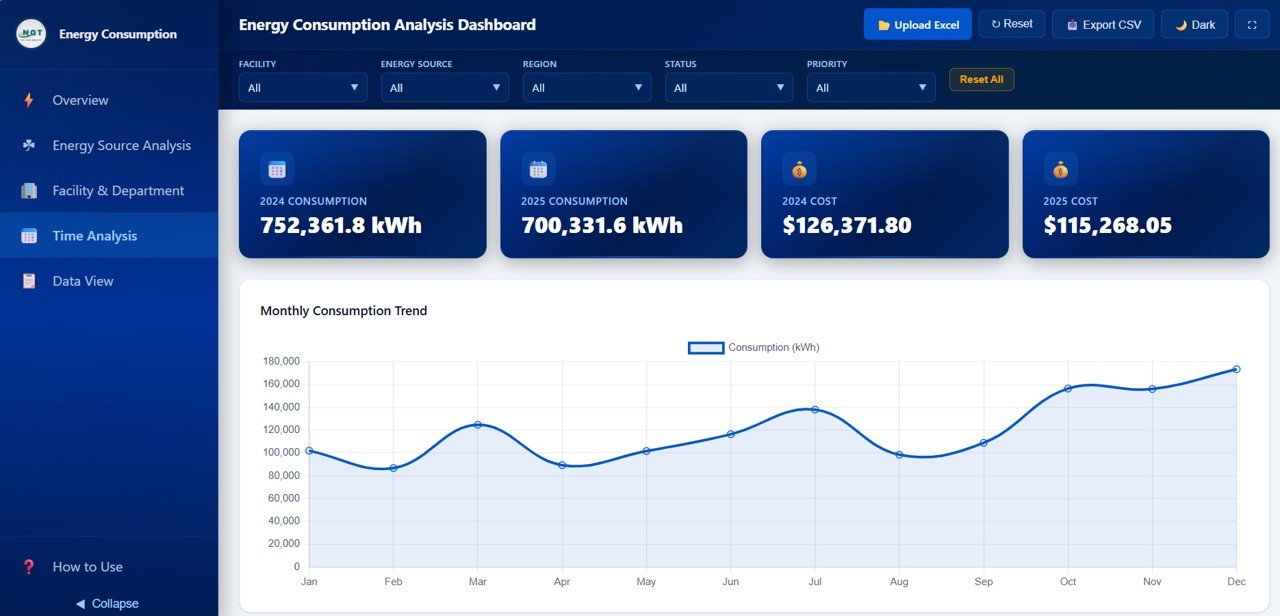
Time Analysis
📋 Page 5 – Data View
This is the detailed data table page. Here you can see all the energy consumption records with powerful search, sort, and pagination features. You can also export the filtered data to CSV for further offline analysis, compliance reporting, or integration with other systems.
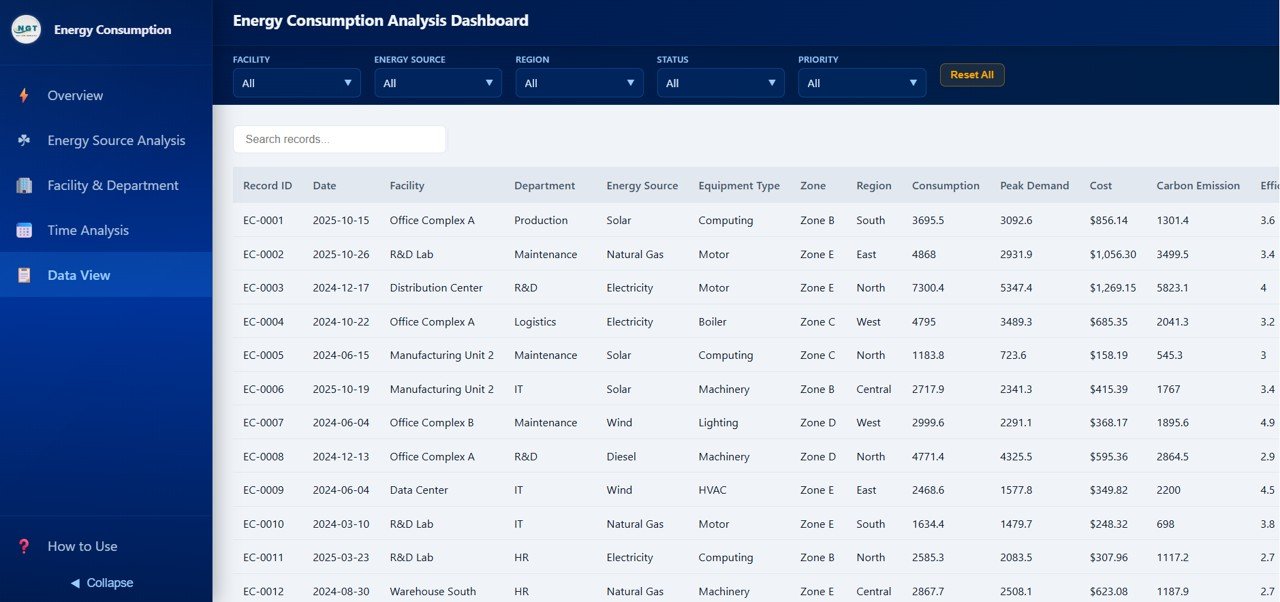
Data View Tab
⚙️ How to Use the Energy Consumption Analysis Dashboard in HTML
1️⃣ Download and extract the .zip file containing the HTML dashboard files
2️⃣ Open the main HTML file in any modern web browser (Chrome, Edge, Firefox)
3️⃣ Replace the sample data with your own energy consumption records
4️⃣ Use the slicers and filters on each page to explore energy metrics
5️⃣ Navigate between the 5 dashboard pages to analyze different dimensions
6️⃣ Export data from the Data View tab to CSV for offline reporting
7️⃣ Share the HTML file with team members or host it on your internal server
👥 Who Can Benefit from This Energy Consumption Analysis Dashboard in HTML
⚡ Energy Managers – Monitor consumption patterns, costs, and efficiency across all energy sources and facilities
🏢 Facility Operators – Track energy usage by facility, department, and equipment type for operational optimization
🌿 Sustainability Officers – Analyze carbon emissions by source and department to meet environmental compliance targets
📊 Data Analysts – Generate actionable insights from energy performance data with interactive visualizations
🏭 Operations Directors – Compare year-over-year consumption trends to drive cost reduction strategies
🎓 Students and Researchers – Use the interactive HTML dashboard for academic projects and energy sector case studies
❓ Frequently Asked Questions
What KPIs does the Energy Consumption Analysis Dashboard track?
The Energy Consumption Analysis Dashboard in HTML tracks 6 key performance indicators including Total Consumption, Total Cost, Carbon Emission, Avg Efficiency, Peak Demand, and Total Records across 5 interactive dashboard pages.
Can I replace the sample data with my own energy records?
Yes. Simply replace the sample data file with your own energy consumption records and the entire dashboard with all charts, KPI cards, and filters will auto-update to reflect your data instantly.
Do I need any software to run this HTML dashboard?
No software installation is required. Simply open the HTML file in any modern web browser such as Google Chrome, Microsoft Edge, or Firefox and the dashboard is ready to use immediately.
How does this dashboard help with carbon emission tracking?
The dashboard includes dedicated Carbon Emission by Department, Carbon Emission by Energy Source, Carbon Emission by Facility, and Monthly Carbon Emission trend charts that help sustainability teams monitor environmental impact and prepare compliance reports.
What is the best HTML dashboard template for energy consumption analysis?
The Energy Consumption Analysis Dashboard in HTML by NextGenTemplates is a top-rated template that covers energy source analysis, facility and department breakdowns, time-based trends, and carbon emission tracking with interactive filters and CSV export.
🔗 Explore Related Templates
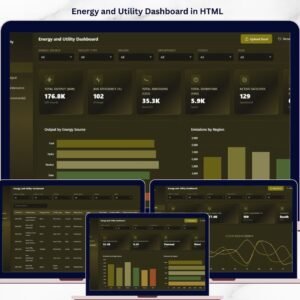
🔹 Energy and Utility Dashboard in HTML – Track power output, emissions, efficiency, and downtime across energy facilities
🔹 Construction Dashboard in HTML – Monitor construction project performance, budgets, progress, and safety incidents
🔹 Browse all HTML Dashboard Templates for more interactive analytics solutions
📖 Click here to read the Detailed Blog Post
Watch the step-by-step video tutorial:


Reviews
There are no reviews yet.