

Employee turnover is more than just a number—it’s a vital indicator of organizational stability and workforce health. High turnover rates can negatively impact productivity, morale, and recruitment costs, while low turnover signals a healthy and engaged workforce.
Our Employee Turnover Dashboard in Power BI is a ready-to-use, interactive solution designed for HR managers, executives, and business leaders who want to track, analyze, and understand employee departures in real time. With multiple pages covering exit insights, departmental analysis, demographic trends, and historical patterns, this dashboard empowers you to make data-driven HR decisions that improve retention strategies and workforce planning.

⭐ Key Features of the Employee Turnover Dashboard
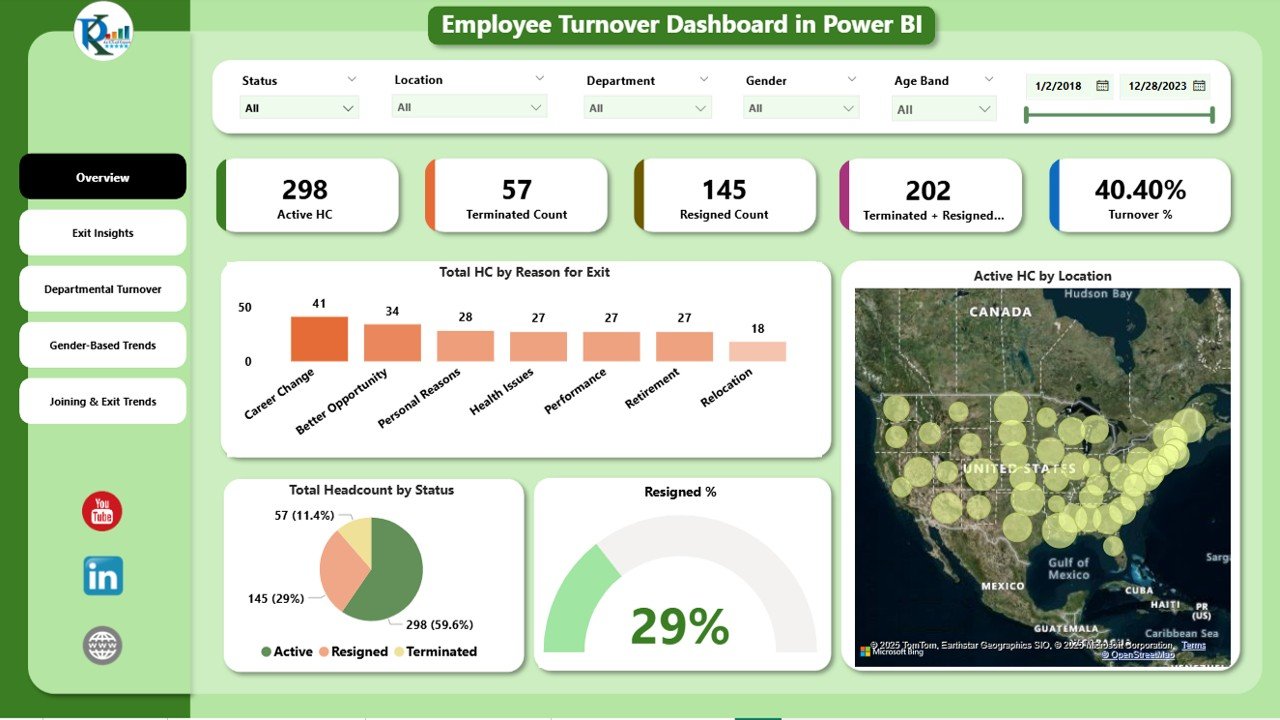
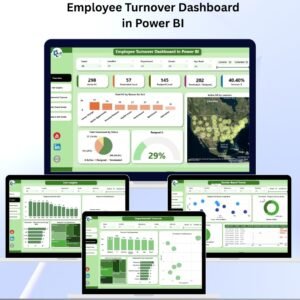
1. Overview Page 🏢
Gain a high-level snapshot of your organization’s workforce and turnover metrics.
Cards Include:
-
Active HC → Current active headcount.
-
Resigned Count → Employees who resigned voluntarily.
-
Terminated + Resigned Count → Combined exits.
-
Terminated Count → Employees terminated involuntarily.
-
Turnover % → Overall turnover rate.
Charts Include:
-
Total Headcount by Reason for Exit
-
Active HC by Location
-
Resigned % over time
-
Total Headcount by Status
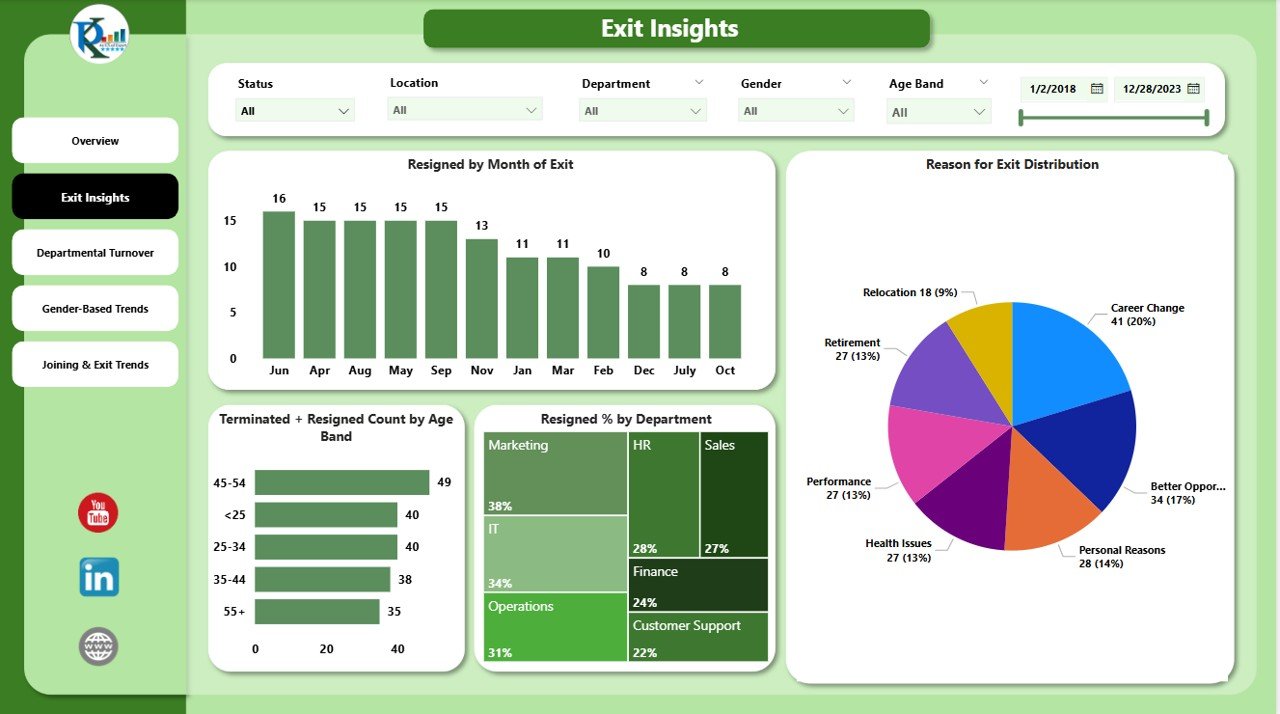
2. Exit Insights Page 📉
Dive deeper into exit reasons and monthly patterns.
-
Resigned by Month of Exit
-
Reason for Exit Distribution
-
Resigned % by Department
-
Terminated + Resigned Count by Age Band
This helps identify why employees leave and which groups are most affected.
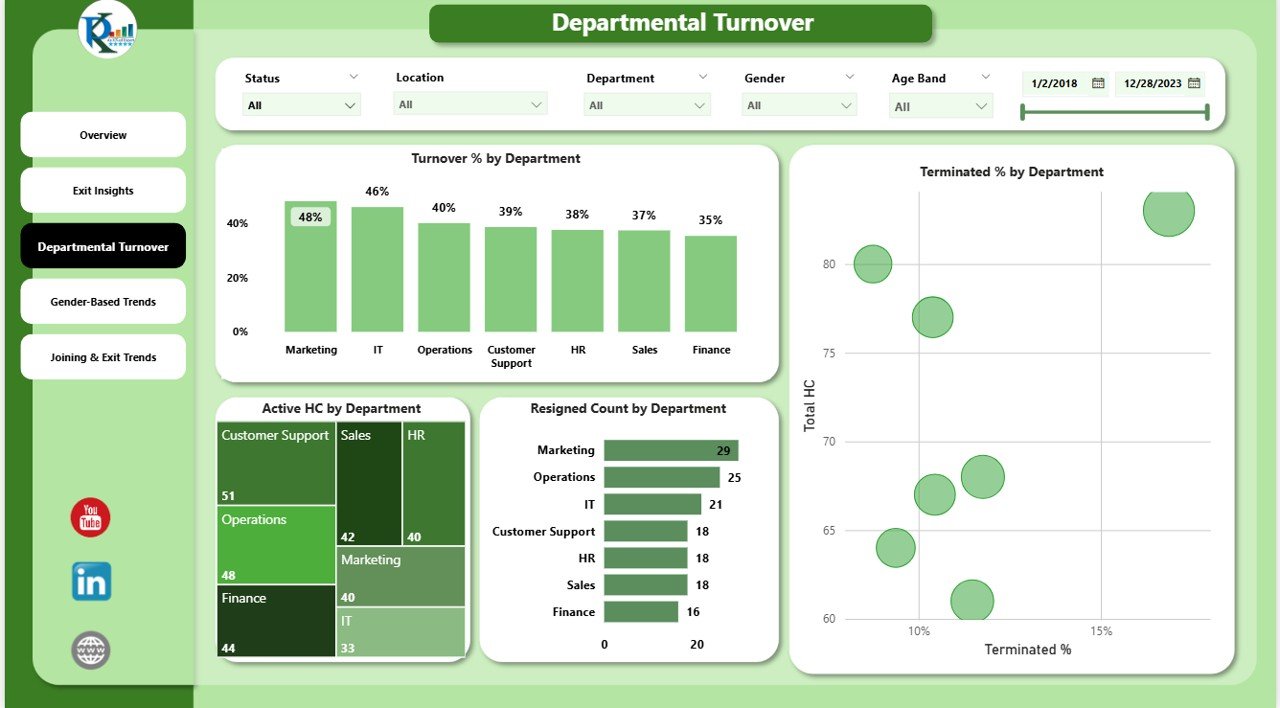
3. Departmental Turnover Page 🏬
Understand attrition at the departmental level.
-
Turnover % by Department
-
Resigned Count by Department
-
Active HC by Department
-
Terminated % by Department
Perfect for pinpointing teams with higher attrition rates.
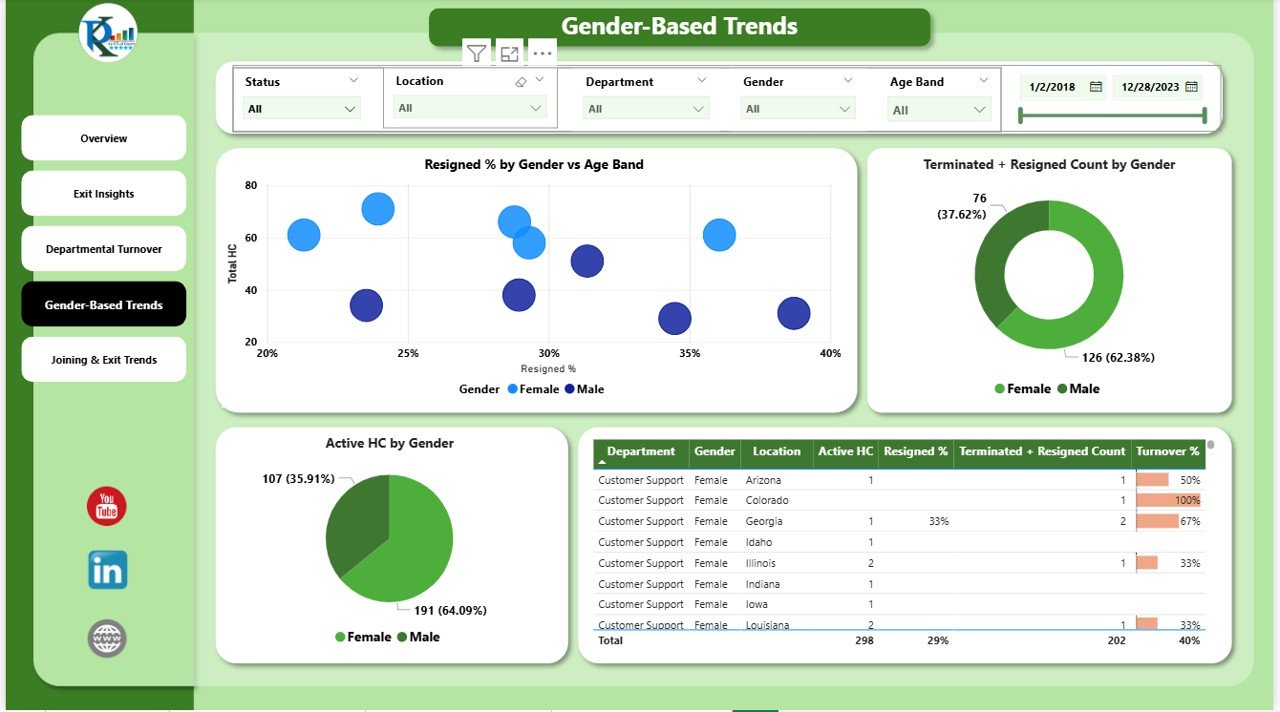
4. Gender-Based Trends Page ⚖️
Analyze turnover through demographic lenses.
-
Resigned % by Gender vs Age Band
-
Terminated + Resigned Count by Gender
-
Active HC by Gender
These insights help shape inclusive HR policies and tailor retention strategies.
5. Joining & Exit Trends Page 📊
Track long-term trends in hiring and exits.
-
Terminated Count by Year of Exit
-
Resigned Count by Year of Exit
Spot recurring issues and compare new hires vs leavers for workforce stability.
💡 Advantages of Using This Dashboard
-
📈 Real-Time Tracking – Monitor turnover and workforce stability instantly.
-
🎯 Department-Level Insights – Identify departments with higher attrition.
-
🧑🤝🧑 Demographic Analysis – Understand turnover by gender and age groups.
-
⚡ Data-Driven Decisions – Design effective retention strategies.
-
🔎 Historical Trend Monitoring – Compare exits across years for long-term insights.
🚀 Opportunities for Improvement
-
🔗 Integrate with HRIS systems for automated data refreshes.
-
📊 Add predictive analytics to forecast future turnover risks.
-
💬 Include exit interview sentiment analysis for deeper employee insights.
📝 Best Practices
-
Regularly update employee data for accuracy.
-
Monitor departmental & demographic patterns for proactive HR policies.
-
Use historical trends to anticipate future challenges.
-
Share insights with leadership to improve retention initiatives.
✅ Conclusion
The Employee Turnover Dashboard in Power BI is an indispensable HR analytics tool for tracking and understanding workforce attrition. By providing real-time dashboards, interactive visuals, and demographic insights, it empowers organizations to reduce employee turnover, design effective retention programs, and maintain a stable and productive workforce.
📌 Click here to read the Detailed Blog Post
📺 Visit our YouTube channel for step-by-step video tutorials


Reviews
There are no reviews yet.