Managing employee benefits has never been easier! The Employee Benefits Report in Excel is a ready-to-use, data-driven tool designed to help HR professionals and business leaders analyze, visualize, and manage all employee benefits efficiently — from health insurance to bonuses and wellness programs.
Built entirely in Microsoft Excel, this report centralizes benefit data into one powerful dashboard. It allows you to track costs, utilization rates, and participation trends, helping your organization make data-backed HR and financial decisions with confidence.
⚙️ Key Features of the Employee Benefits Report in Excel
This Excel-based template includes multiple analytical sheets that simplify tracking, comparison, and forecasting of benefit programs across your organization.
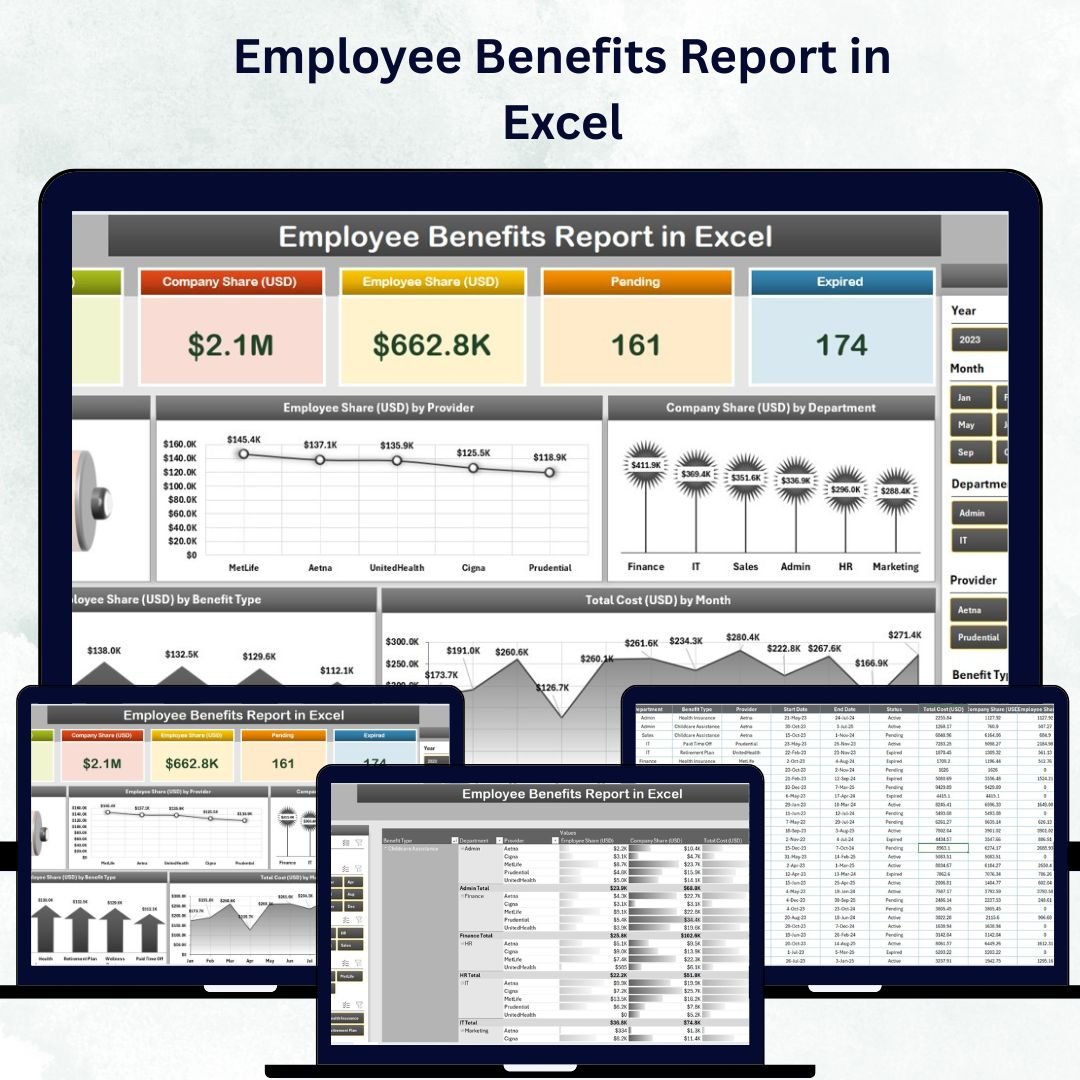
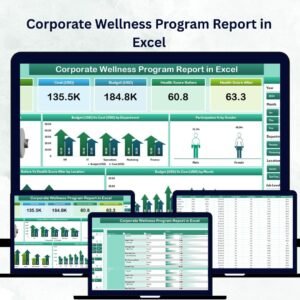
🏠 1️⃣ Home / Dashboard Page – Your Benefits Overview
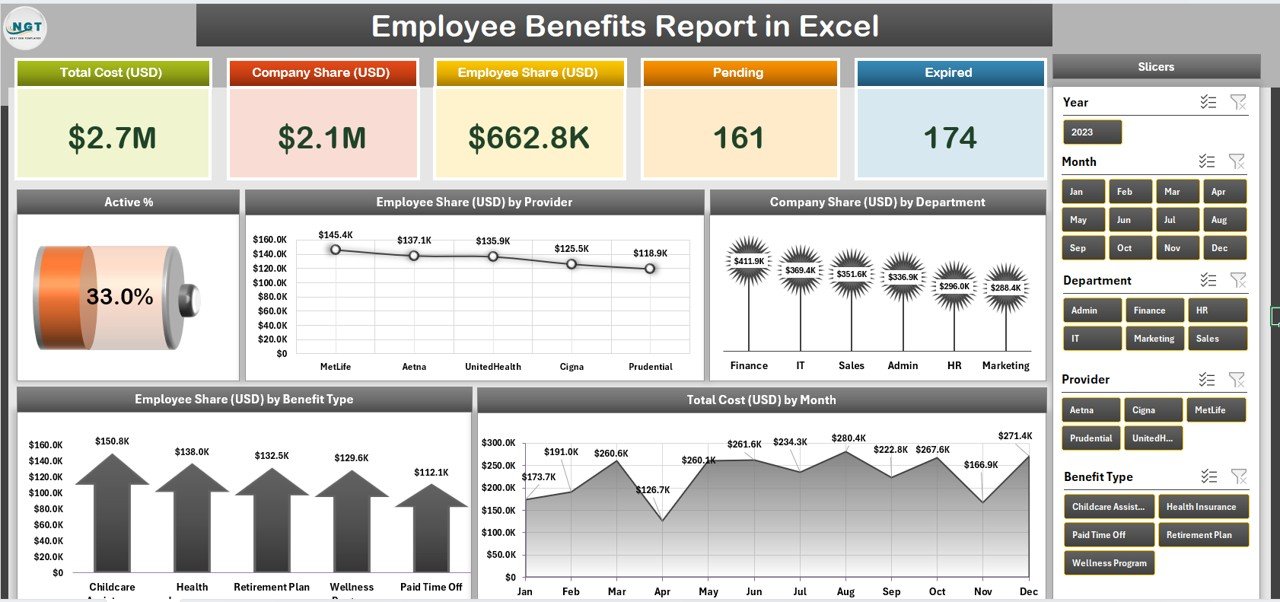
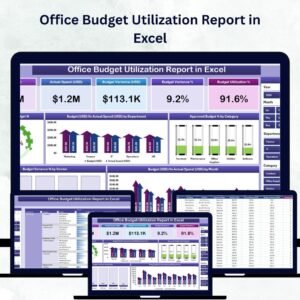
The Dashboard provides a bird’s-eye view of key HR metrics, making it the heart of the report.
Highlights:
-
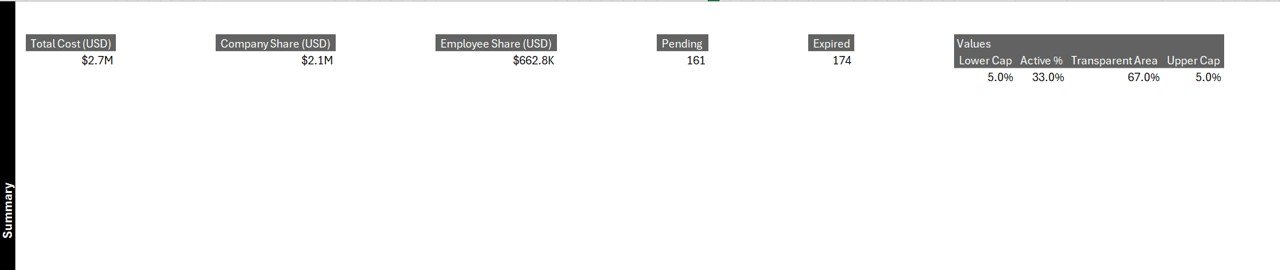
KPI Cards: Display Total Benefits Cost, Average Cost per Employee, and Utilization %
-
Interactive Slicers: Filter data by department, employment type, or location
-
Charts:
-
Cost Distribution by Benefit Type
-
Utilization Trend Over Time
-
Total Benefits Cost by Department
-
Employee Satisfaction vs. Benefit Cost
-
This visual summary allows managers to understand benefit spending and employee engagement instantly.
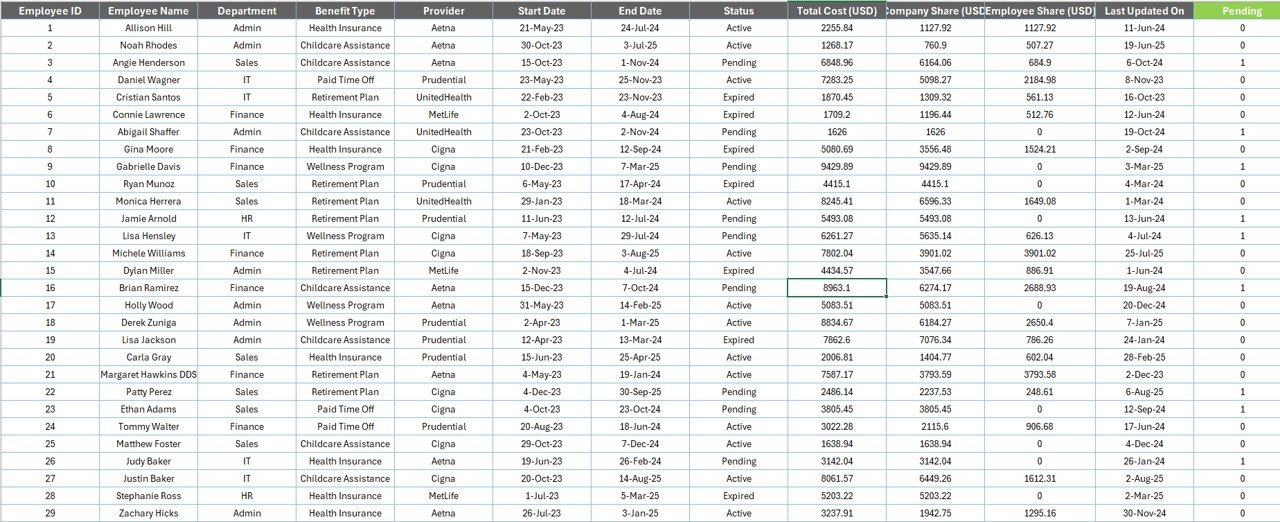
👥 2️⃣ Employee Data Sheet – The Foundation of Your Report
This sheet holds all employee information including:
-
Employee ID, Name, Department, Designation, Joining Date, and Status
-
Acts as a reference for lookups and calculations
-
Ensures every benefit entry ties directly to a verified employee record
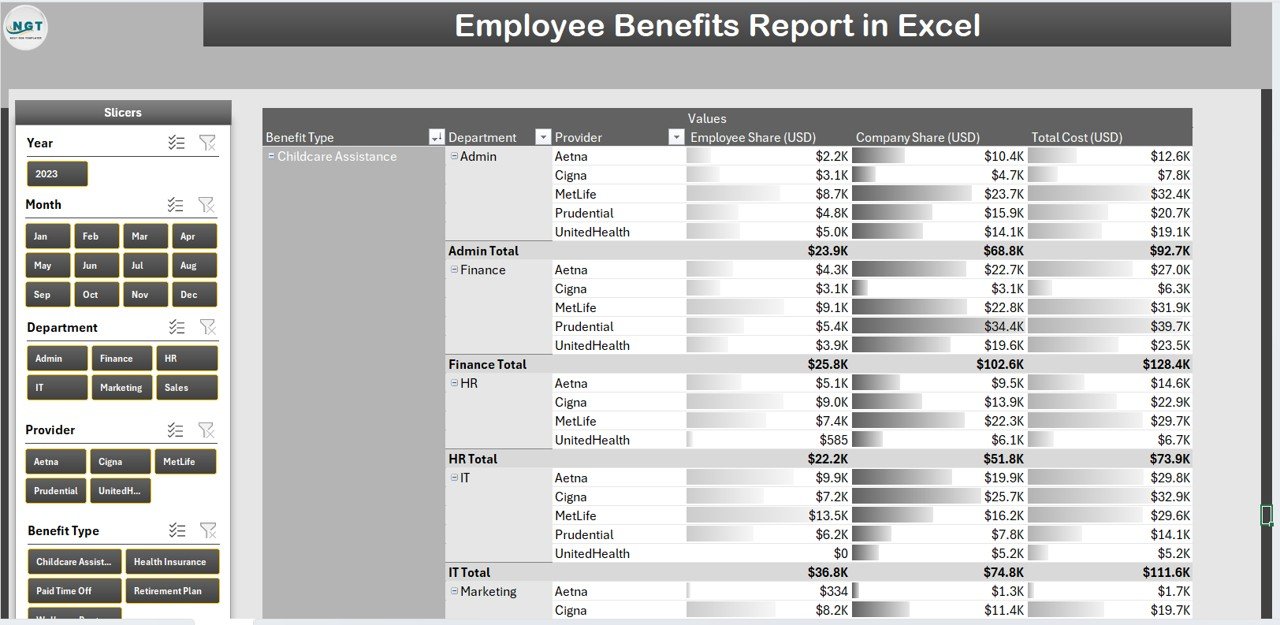
💰 3️⃣ Benefit Details Sheet – Track All Benefits Accurately
This section lists all benefit programs such as:
-
Health Insurance, Medical Reimbursements, Pension, and Bonuses
-
Employer vs Employee Contributions
-
Monthly and Year-to-Date (YTD) totals
-
Conditional formatting to highlight high or low utilization rates
It’s perfect for cost tracking and program comparison across time periods.
📊 4️⃣ Benefit Utilization Sheet – Measure Engagement
This sheet helps you identify how many employees are using specific benefits and at what cost.
Insights You’ll Get:
-
Underused vs. Overused benefits
-
Total participation rates
-
Cost per utilized benefit
Use this data to improve program effectiveness and employee satisfaction.
🏢 5️⃣ Departmental Summary – Compare Teams Easily
Evaluate how benefit costs vary across departments.
-
Track Total Cost per Department
-
Average Benefit per Employee
-
Utilization Comparison by Team
This view makes it easy for management to align benefits spending with workforce needs.
📈 6️⃣ Charts & KPIs Sheet – Visualize Data Trends
Dynamic charts and pivot tables automatically update when data changes.
Example Visuals:
-
Benefits Cost Trend by Month
-
Utilization by Benefit Category
-
Departmental Comparison Charts
With just a few clicks, you can turn raw data into an actionable story for leadership.
🧩 What’s Inside the Employee Benefits Report
✅ 6 Organized Sheets: Dashboard, Employee Data, Benefit Details, Utilization, Department Summary, and Charts
✅ Pre-Built Formulas: SUMIFS, AVERAGEIFS, and VLOOKUP for automated calculations
✅ Interactive Slicers & Filters: For intuitive data navigation
✅ Customizable Design: Easily add or modify benefit types and categories
✅ Visual Indicators: Color-coded KPIs for faster interpretation
💡 How to Use the Employee Benefits Report
1️⃣ Input Employee Data: Add employee information and benefit details.
2️⃣ Record Monthly Data: Enter benefit amounts, employer/employee contributions, and periods.
3️⃣ Refresh Dashboard: Use pivot table refresh to update all visuals.
4️⃣ Analyze Trends: Filter by department or benefit type to find insights.
5️⃣ Present Results: Export the dashboard for management reporting.
Within minutes, your Excel report turns data into a comprehensive HR benefits summary.
🌟 Who Can Benefit from This Report
👩💼 HR Managers: Simplify benefit tracking and reporting.
💰 Finance Teams: Analyze benefit spending patterns.
🏢 Business Leaders: Evaluate employee engagement and satisfaction trends.
🏫 SMEs & Startups: Manage benefits efficiently without expensive HR software.
📈 Advantages of the Employee Benefits Report in Excel
✔️ Better Decision-Making: Visuals help identify high-value and underused benefits.
✔️ Cost Optimization: Adjust budgets using accurate utilization insights.
✔️ Transparency: Builds trust through clear reporting of total benefits.
✔️ Forecasting: Predict future costs and satisfaction rates using historical data.
✔️ Scalability: Suitable for both small and large organizations.
🧠 Best Practices for Using This Template
✅ Maintain consistent benefit category names.
✅ Update the report monthly or quarterly.
✅ Protect sensitive HR data with password security.
✅ Use macros for automation if handling large datasets.
✅ Keep visualizations clear and minimal for quick interpretation.
💬 Example Use Case
A mid-sized firm used this dashboard to track employee wellness programs and noticed underutilization in gym memberships. After redesigning the perk, participation increased by 40%, improving satisfaction while optimizing costs.
That’s the power of data-driven HR reporting — made simple with Excel!
🎯 Conclusion
The Employee Benefits Report in Excel empowers HR and finance teams to monitor, evaluate, and optimize employee benefit programs effectively. With dynamic visuals, auto-calculations, and interactive charts, this Excel-based solution delivers clarity and control over benefit data.
Whether you’re managing 50 employees or 5,000, this report ensures smarter planning, better engagement, and improved organizational transparency — all within a single Excel file.
🔗 Click here to read the Detailed Blog Post
🎥 Visit our YouTube channel for tutorials
🔗 YouTube.com/@PKAnExcelExpert


Reviews
There are no reviews yet.