📊 Employee Benefits Dashboard in Power BI
In today’s competitive business world, employee benefits are a game-changer. They not only help attract and retain top talent but also enhance job satisfaction, loyalty, and engagement. However, managing benefits across multiple departments, providers, and benefit types can be overwhelming without proper visualization. That’s why we’ve created the Employee Benefits Dashboard in Power BI—a ready-to-use solution that simplifies HR and finance decision-making with real-time insights.
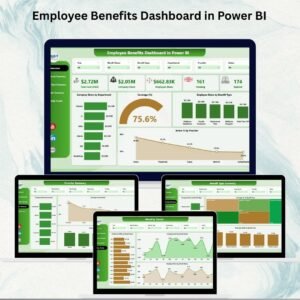
This dashboard consolidates all benefit-related data into a single, interactive platform. With clear visuals, slicers, and KPIs, HR teams and executives can track cost distribution, coverage percentage, employee vs. company share, provider performance, and monthly trends—all at a glance.
Unlike static spreadsheets, this Power BI dashboard brings dynamic reporting, automation, and transparency, making it a must-have tool for organizations of all sizes.
🔑 Key Features of the Employee Benefits Dashboard
-
📌 Overview Page – Quick Snapshot
-
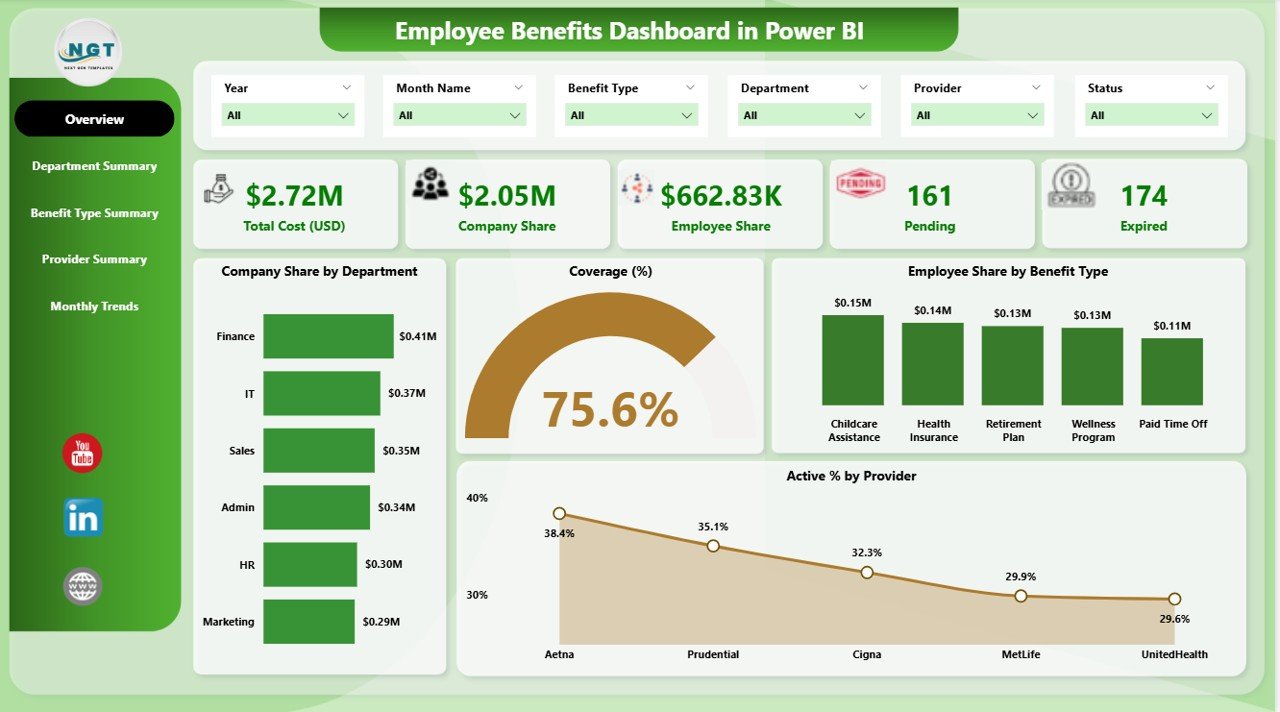
6 interactive slicers to filter by department, provider, benefit type, and time period.
-
5 KPI cards covering total benefits cost, company share, employee contribution, coverage %, and active provider rate.
-
Charts like Company Share by Department, Coverage %, Employee Share by Benefit Type, and Active % by Provider.
-
-
🏢 Department Summary Page – Cost Breakdown by Teams
-
Department-level insights for HR and management.
-
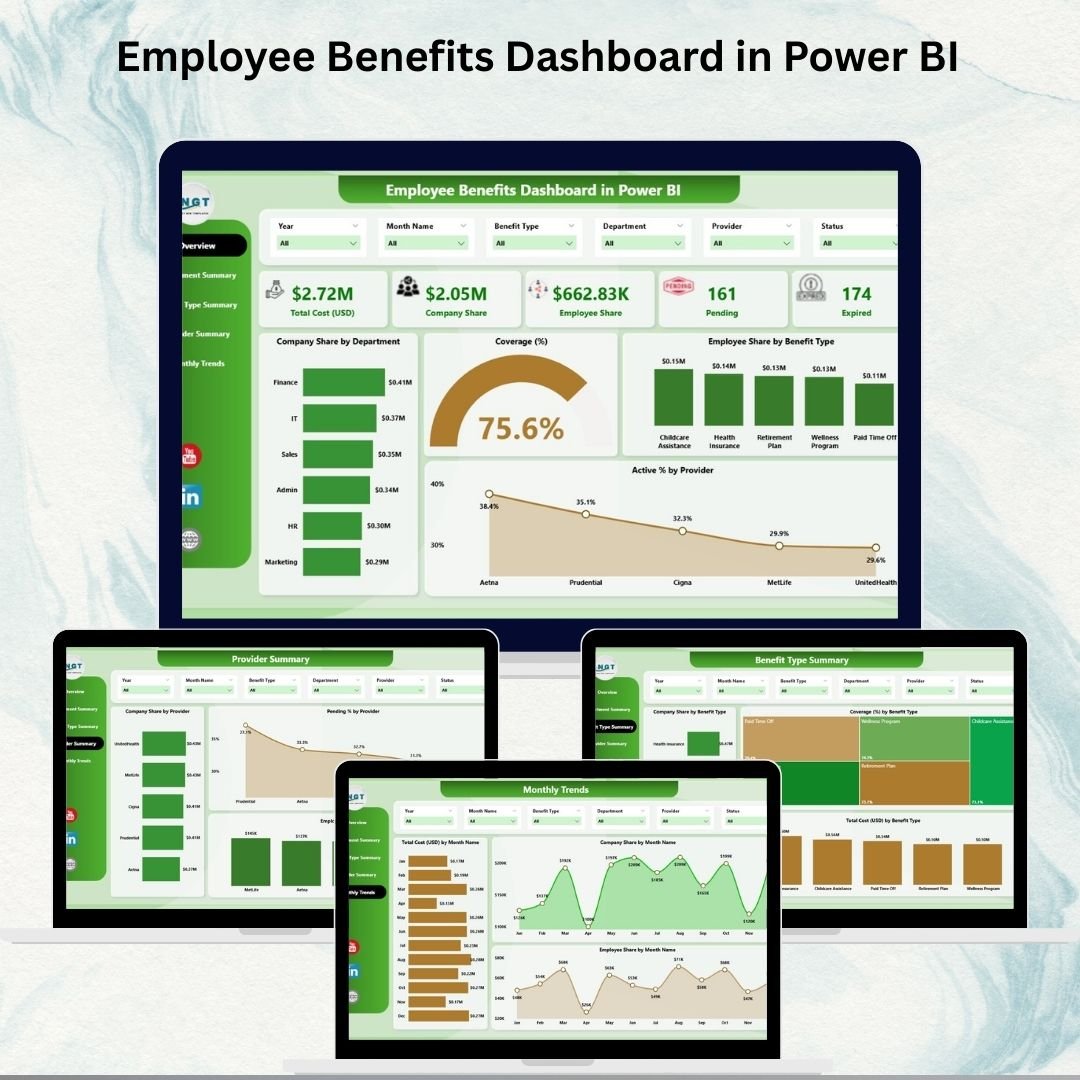
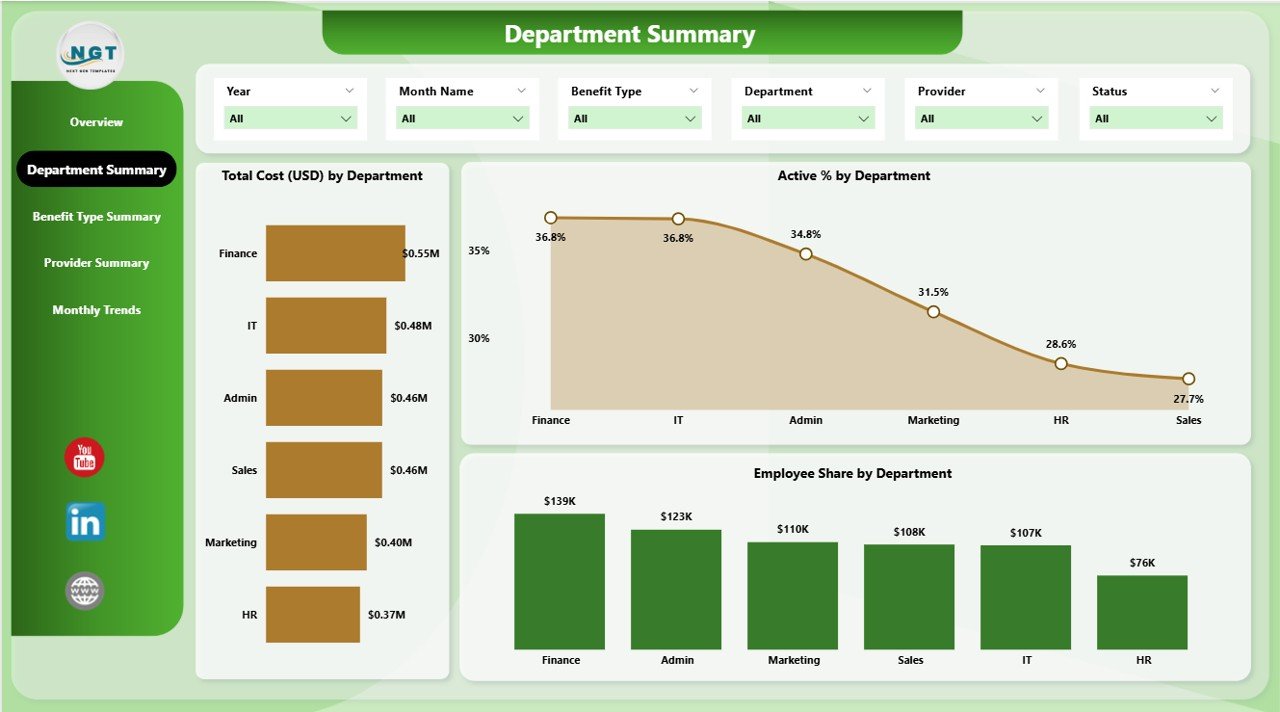
Charts showing Total Cost by Department, Active % by Department, and Employee Share by Department.
-
-
🎯 Benefit Type Summary Page – Category-Level Insights
-
Drill down into benefit types like health insurance, retirement plans, or wellness programs.
-
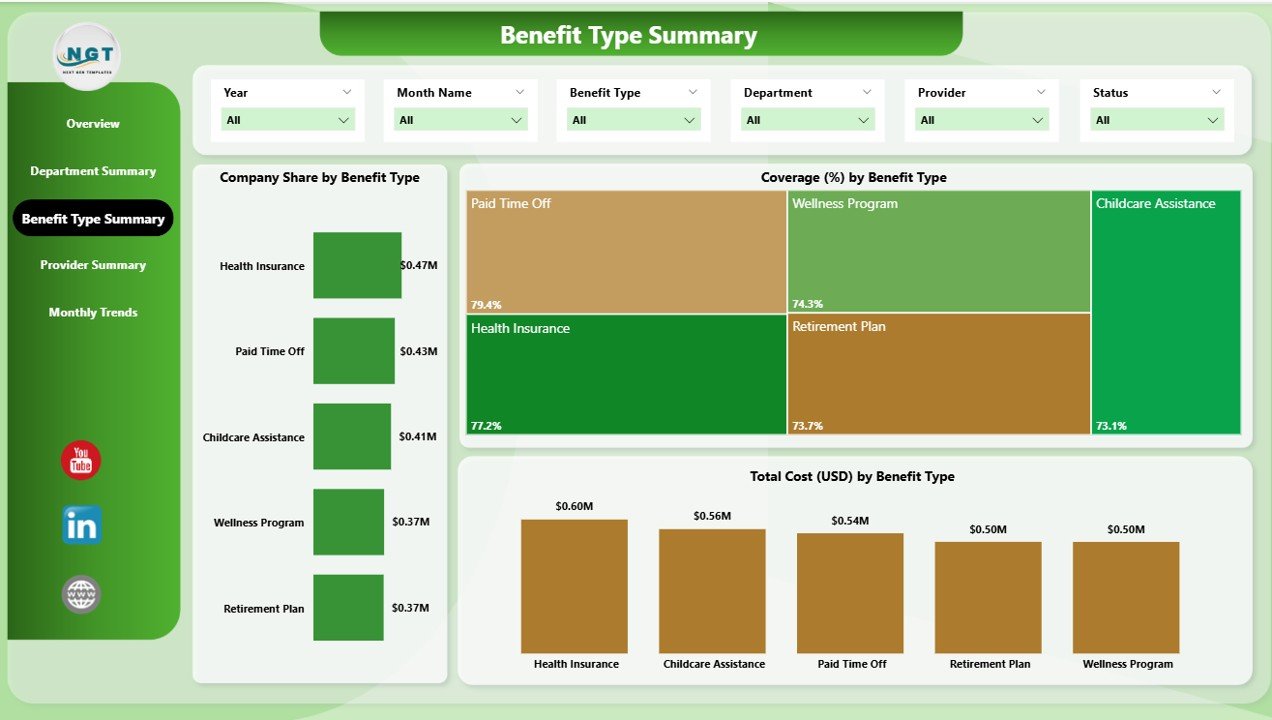
Charts showing Company Share, Coverage %, and Total Cost by Benefit Type.
-
-
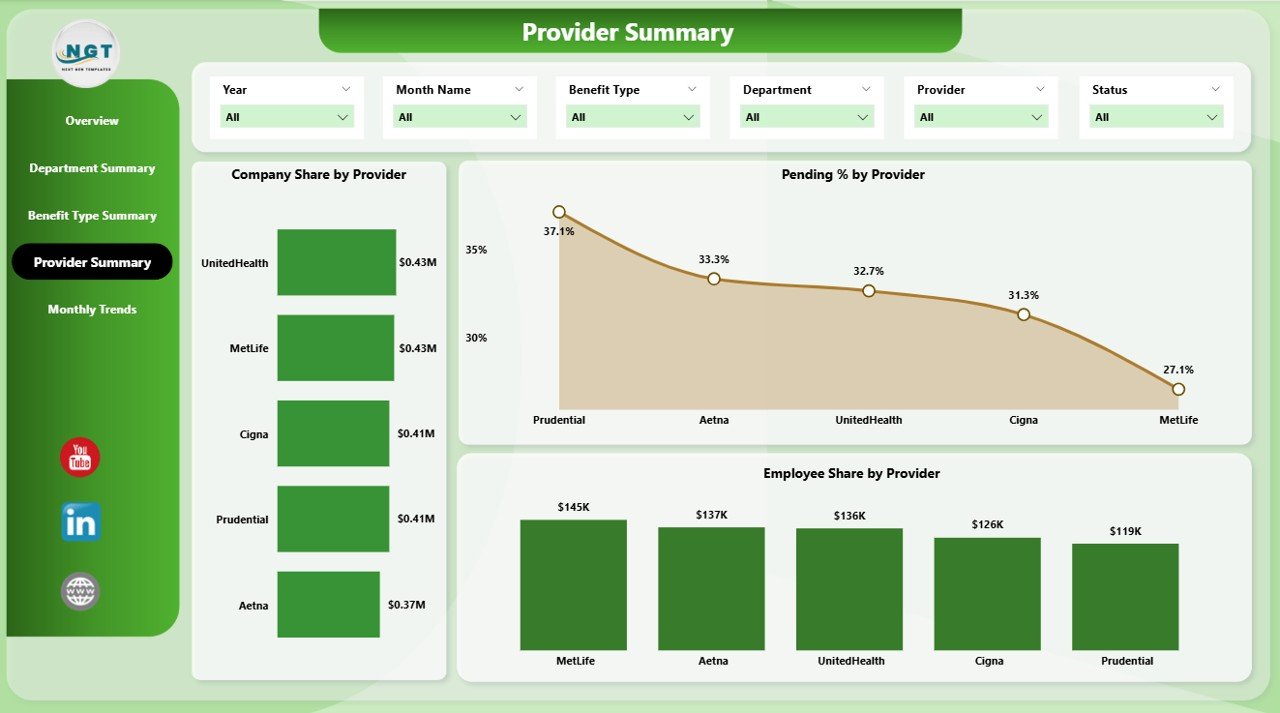
🤝 Provider Summary Page – Vendor Performance Tracking
-
Evaluate provider reliability and performance.
-
Charts include Company Share by Provider, Pending % by Provider, and Employee Share by Provider.
-
-
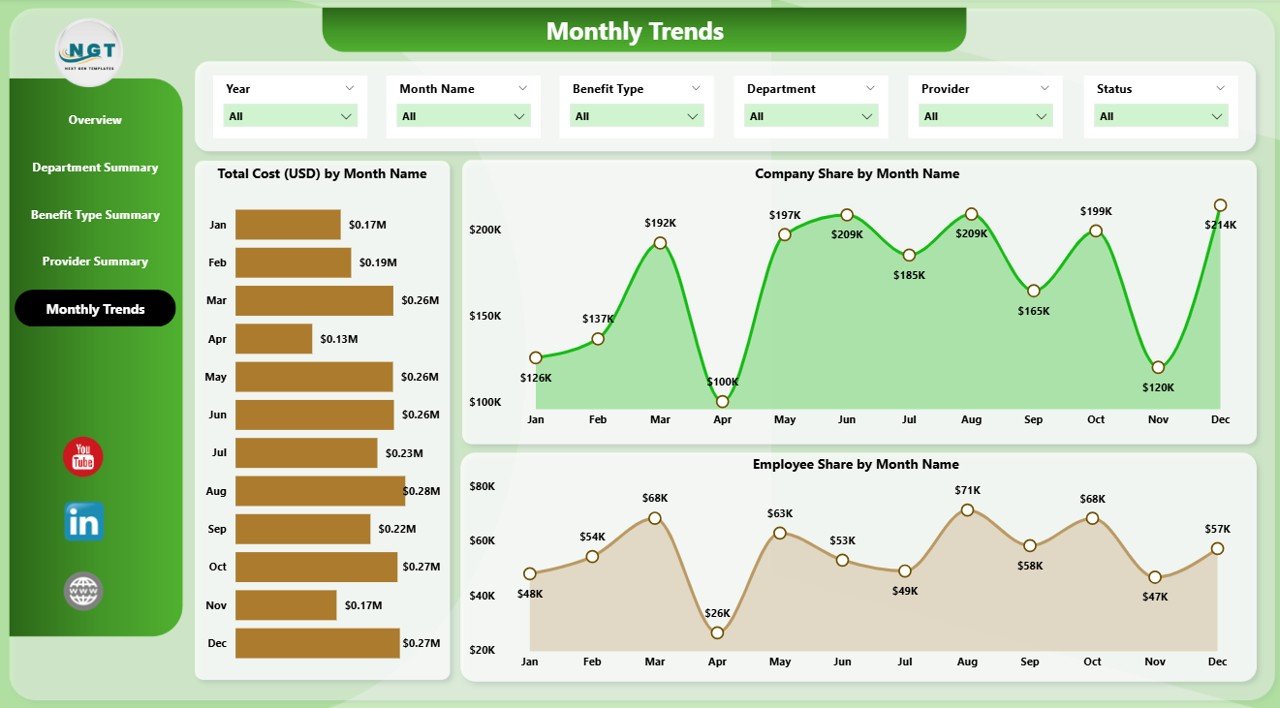
📅 Monthly Trends Page – Time-Based Analysis
-
Monitor how benefit costs and participation change month-to-month.
-
Charts include Total Cost by Month, Company Share by Month, and Employee Share by Month.
-
📦 What’s Inside the Dashboard
1️⃣ Pre-built Power BI Dashboard file with 5 analytical pages.
2️⃣ Excel-based data structure for easy data updates.
3️⃣ KPI cards, slicers, and interactive visuals.
4️⃣ Pages for overview, department, benefit type, provider, and trends.
5️⃣ Ready-to-use formulas and filters for HR teams.
🛠️ How to Use the Dashboard
✔ Step 1 – Gather employee benefits data in Excel.
✔ Step 2 – Connect the file to Power BI.
✔ Step 3 – Use slicers and filters to analyze by department, provider, or benefit type.
✔ Step 4 – Track monthly trends for proactive budgeting.
✔ Step 5 – Share dashboard insights with HR and management teams.
👥 Who Can Benefit from This Dashboard?
-
HR Managers – To track participation, costs, and employee coverage.
-
Finance Teams – To analyze company vs. employee share and manage budgets.
-
Executives – To gain quick insights into overall benefits performance.
-
Small & Medium Businesses – To improve transparency without heavy IT investment.
-
Large Enterprises – To manage multi-departmental benefits efficiently.
✅ Advantages of the Employee Benefits Dashboard
-
Centralized View – All benefits data in one platform.
-
Cost Transparency – Clear breakdown of company and employee contributions.
-
Better Decisions – Supports HR and finance with actionable insights.
-
Engagement Boost – Transparent benefits improve employee trust.
-
Custom Filtering – Drill down by department, provider, or benefit type.
-
Scalable – Works for startups, SMEs, and large enterprises.
🚀 Opportunities for Improvement
-
Payroll Integration – Auto-sync with payroll systems.
-
Predictive Analytics – AI models to forecast benefit costs.
-
Employee Self-Service – A portal for staff to view benefits.
-
Mobile Optimization – For easy access on the go.
-
Wellness Data – Track wellness program participation.
📌 Best Practices for Using the Dashboard
-
Automate data refresh for real-time accuracy.
-
Use simple, clear visuals for easy interpretation.
-
Regularly review KPIs against company goals.
-
Train HR staff to use slicers and filters effectively.
-
Secure sensitive HR and payroll data.
-
Set custom alerts for unusual cost increases.
🏆 Conclusion
The Employee Benefits Dashboard in Power BI is more than a reporting tool—it’s a strategic advantage. By bringing together all benefits data into one visual, interactive platform, it allows organizations to streamline HR operations, manage costs effectively, and boost employee satisfaction.
With pages for department, provider, benefit type, and trends, this dashboard provides the transparency, insights, and flexibility organizations need to stay competitive in today’s workforce.
📖 Click here to read the Detailed Blog Post
🎥 Visit our YouTube channel for step-by-step tutorials
👉 Youtube.com/@PKAnExcelExpert



Reviews
There are no reviews yet.