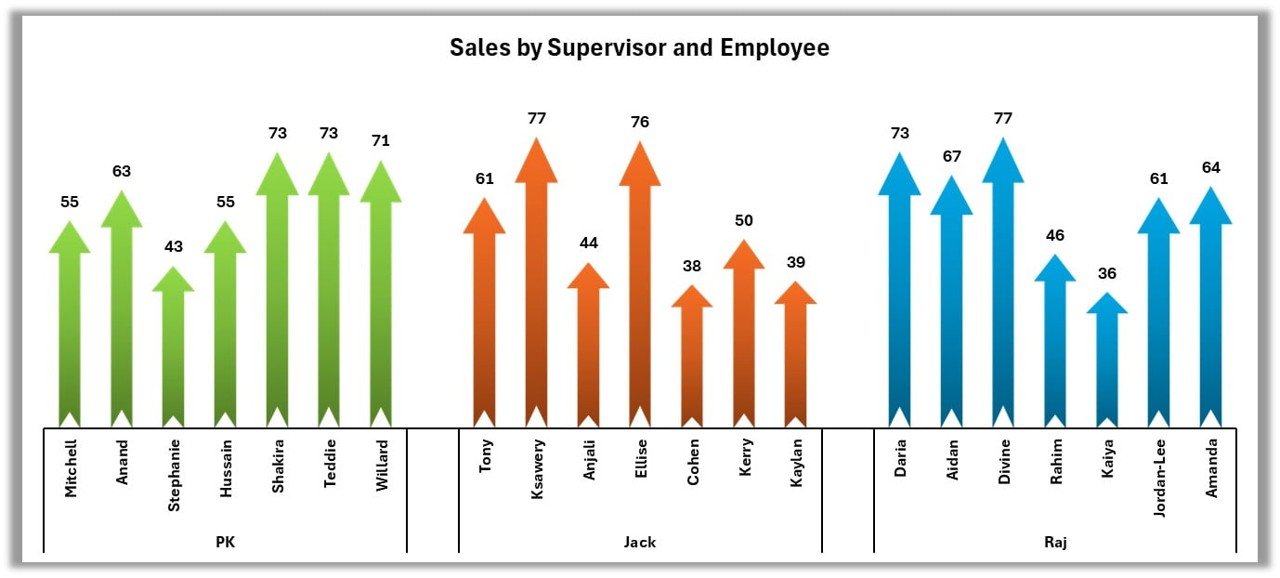
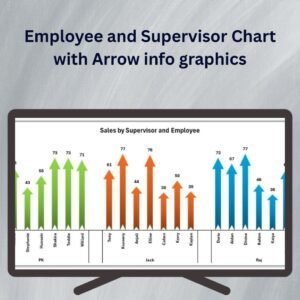
The Employee and Supervisor Chart with Arrow info graphics in Excel is a visually engaging and highly functional tool designed to simplify the management and tracking of employee performance. This chart provides a clear, easy-to-understand visual representation of employee and supervisor relationships, performance data, and progress toward goals, making it ideal for HR departments, managers, and project leaders.
Using arrow infographics, this chart allows you to visually track key metrics such as employee performance, supervisor effectiveness, and team progress. It’s perfect for performance reviews, project management, or organizational chart creation. Fully customizable, this tool can be adapted to suit your specific needs, whether you’re tracking individual performance or monitoring team or department-wide metrics.
Key Features of the Employee and Supervisor Chart with Arrow info graphics
📌 Interactive Arrow Infographics
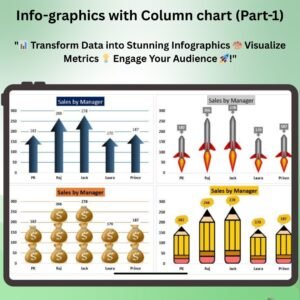
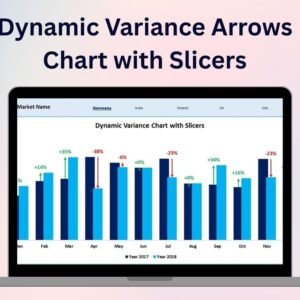
The chart uses arrows to show performance trends and relationships between employees and supervisors. This visual representation makes it easy to track progress, identify issues, and highlight areas of improvement.
🛠 Customizable Metrics
You can easily customize the chart to reflect the metrics most important to your organization, whether it’s performance, sales targets, or project milestones. Modify categories, add new data points, and adjust the chart to match your goals.
💡 Easy-to-Read Visuals
The arrow infographics are designed for simplicity and clarity, allowing you to understand the data at a glance. It’s an intuitive tool that doesn’t require any advanced Excel skills to set up or use.
🔢 Real-Time Data Integration
The chart updates automatically as new data is entered, ensuring you always have up-to-date insights into employee performance and progress. Track goals, achievements, and performance trends in real time.
🚀 Multiple Use Cases
Whether you are tracking individual employee performance, supervisor effectiveness, or team progress toward a goal, this chart is versatile enough to fit any organizational need. It can be used for performance reviews, project tracking, or organizational charts.
📊 Comprehensive Reporting
Generate reports and summaries based on the data you input. The chart’s visual nature makes it easy to present data during meetings or in performance reviews, helping stakeholders make informed decisions.
⚙ Simple Setup and Customization
This template is user-friendly and can be quickly customized to match your organization’s needs. Adjust metrics, categories, and visual elements with ease.
🚀 Why You’ll Love the Employee and Supervisor Chart with Arrow Infographics
✅ Clear Visual Representation – Easily track employee performance and supervisor effectiveness with arrow infographics. ✅ Customizable for Any Organization – Adapt the chart to reflect the metrics most important to your team or business. ✅ Real-Time Tracking – Automatically update the chart with new data for accurate performance tracking. ✅ Simple to Use – No advanced Excel skills required to implement or customize the chart. ✅ Professional Reporting – Generate reports and share data with stakeholders in a clear, visually compelling format.
📂 What’s Inside the Employee and Supervisor Chart with Arrow Infographics?
- Arrow Infographics: Visual arrows to track relationships, performance trends, and goal progress.
- Customizable Metrics: Adjust categories to match your specific performance tracking needs.
- Real-Time Data Updates: Automatically update as you enter new data.
- Easy Reporting: Generate reports based on your input data.
🔍 How to Use the Employee and Supervisor Chart with Arrow Infographics
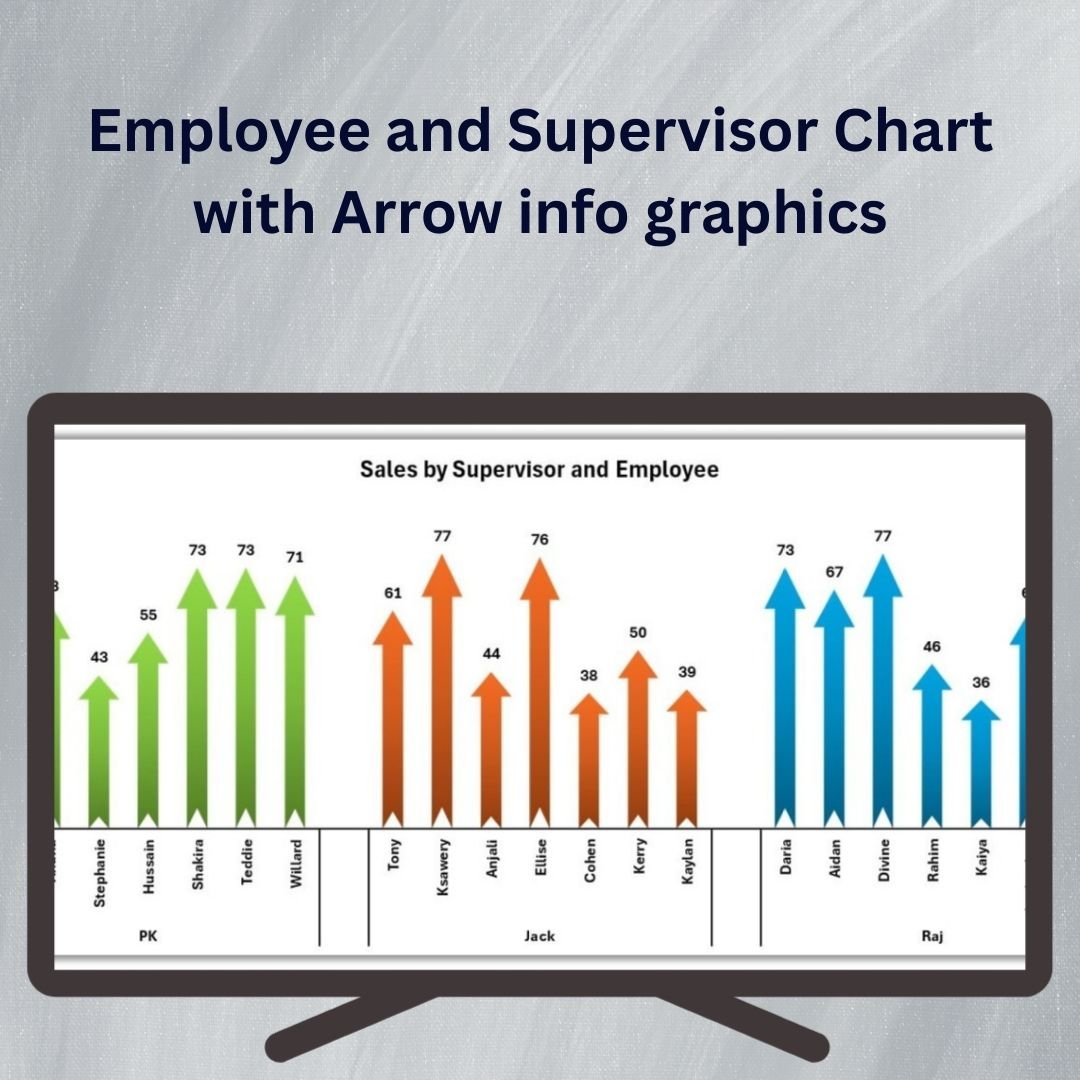
1️⃣ Download the Template – Instantly access the Excel template upon purchase. 2️⃣ Customize the Metrics – Modify categories to track the data that’s most relevant to your needs. 3️⃣ Enter Data – Input employee and supervisor data to begin tracking performance. 4️⃣ Track Progress – Watch the arrows adjust dynamically based on the data entered. 5️⃣ Generate Reports – Use the data to create performance summaries or presentations.
🎯 Who Can Benefit from This Employee and Supervisor Chart with Arrow Infographics? 🔹 HR Departments 🔹 Managers and Supervisors 🔹 Project Managers 🔹 Business Analysts 🔹 Performance Review Teams 🔹 Anyone tracking employee performance and team progress
Streamline your employee and supervisor tracking with the Employee and Supervisor Chart with Arrow Infographics. This visual tool makes it easy to monitor progress, assess performance, and make data-driven decisions quickly and effectively.
Click here to read the Detailed blog post
https://www.pk-anexcelexpert.com/employee-and-supervisor-chart-with-arrow-info-graphics/








Reviews
There are no reviews yet.