


The Email Marketing KPI Dashboard in Power BI is a game-changing solution for marketers who want to track, visualize, and optimize their email campaign performance in real time.
In a world where every open, click, and conversion matters, this interactive Power BI dashboard gives you complete visibility into the effectiveness of your campaigns — helping you turn data into action and insights into results.
Whether you’re a marketing strategist, campaign manager, or digital analyst, this dashboard consolidates all your key performance indicators (KPIs) into one centralized, easy-to-navigate workspace — empowering data-driven marketing decisions with clarity and confidence.
✨ Key Features of the Email Marketing KPI Dashboard in Power BI
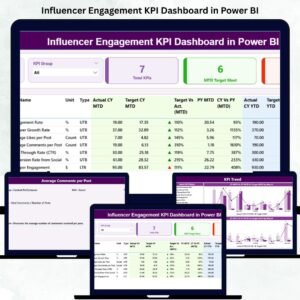
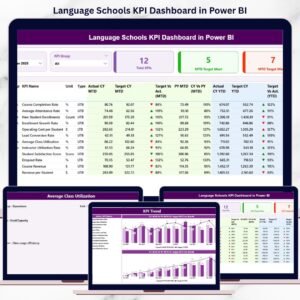
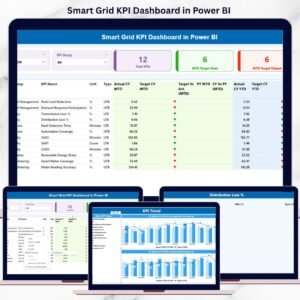
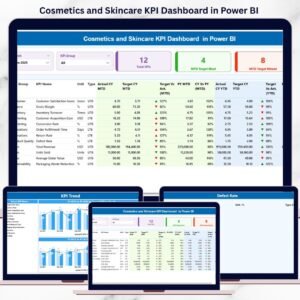
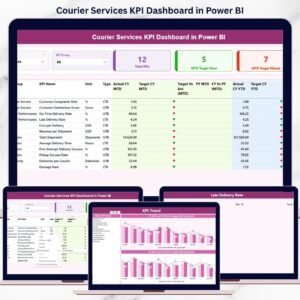
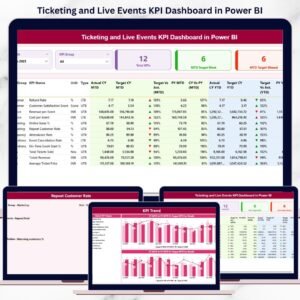
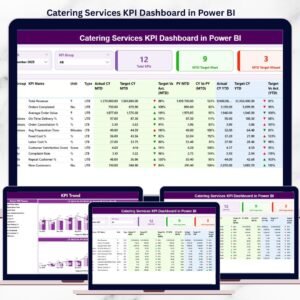
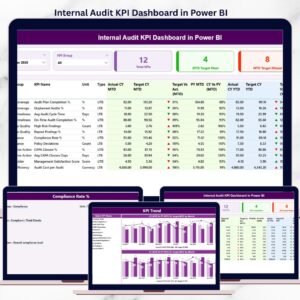
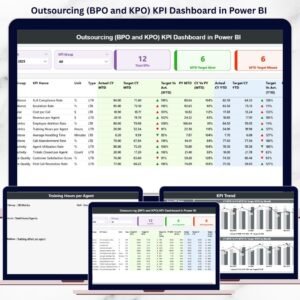
✅ 📊 Summary Page – Complete Campaign Overview

Gain instant insights into the overall performance of your email campaigns.
Features include:
-
Month and KPI Group Slicers for targeted filtering.
-
KPI Cards showing:
-
Total KPIs Count
-
MTD (Month-to-Date) Target Met Count
-
MTD Target Missed Count
-
-
A detailed KPI Table with:
-
KPI Number, Group, Name, and Unit
-
Actual vs Target values (MTD & YTD)
-
CY vs PY performance comparisons
-
📈 Quickly assess your campaign health and target achievement across multiple timeframes.
✅ 📈 KPI Trend Page – Track Performance Over Time
Visualize how each KPI evolves monthly or yearly.
Includes combo charts comparing Actual, Target, and Previous Year data for both MTD and YTD metrics.
🎯 Spot engagement spikes, identify seasonal patterns, and measure campaign ROI trends effortlessly.
✅ 📘 KPI Definition Page – Deep Dive into Metrics
Understand every metric that powers your campaign decisions.
Displays KPI details such as:
-
Formula, Unit, and Definition
-
Type (UTB/LTB)
-
Direct navigation back to the Summary Page
💡 Perfect for teams that want full clarity on how each KPI is calculated.
📦 What’s Inside the Dashboard
💾 Power BI File (.PBIX):
Fully interactive dashboard with slicers, cards, trend charts, and drill-through pages.
📊 Excel Data Source:
Three structured worksheets for:
1️⃣ Input_Actual – Stores real-time campaign data (CTR, Open Rate, etc.).
2️⃣ Input_Target – Records target KPIs.
3️⃣ KPI_Definition – Defines formulas, units, and performance rules.
⚙️ Just update your Excel file — Power BI automatically refreshes your visuals.
👥 Who Can Benefit from This Dashboard
💼 Marketing Managers – Track multiple campaigns and measure performance goals.
📩 Email Marketers – Optimize open rates, CTRs, and conversions.
📊 Data Analysts – Visualize campaign data for actionable insights.
🏢 Agencies – Monitor campaign ROI across clients.
💰 Executives – View summarized performance metrics and business impact.
This dashboard caters to businesses of all sizes — from startups to enterprise-level marketing teams.
💡 Advantages of the Email Marketing KPI Dashboard in Power BI
✅ Centralized Analytics – View all KPIs in one interactive workspace.
✅ Real-Time Insights – Auto-refresh for up-to-date performance tracking.
✅ Customizable Design – Add or edit KPIs to match your marketing strategy.
✅ Data-Driven Optimization – Identify what’s working and what’s not.
✅ Scalable Solution – Integrate multiple campaigns and data sources easily.
✅ Time-Saving Automation – Reduce manual reporting hours by 80%.
⚡ Transform your marketing analytics from static spreadsheets into dynamic intelligence.
🧠 Best Practices for Using the Dashboard
✔️ Update the Excel data source after each campaign cycle.
✔️ Review MTD and YTD comparisons regularly for trend insights.
✔️ Use slicers to focus on specific KPIs or months.
✔️ Maintain consistent KPI naming for seamless tracking.
✔️ Apply conditional formatting to highlight high-performing campaigns.
✔️ Share Power BI dashboards securely via the Power BI Service.
With these best practices, your team will gain a clear, data-driven view of campaign performance.
🔗 Click here to read the Detailed Blog Post
🎥 Visit our YouTube channel to learn step-by-step video tutorials


Reviews
There are no reviews yet.