In the fast-moving electronics and semiconductor industry, performance is everything. ⚡Electronics & Semiconductors KPI Dashboard in Excel With global supply chain challenges, rising production costs, and rapidly evolving technology, businesses can’t afford to rely on outdated reporting methods. That’s why we built the Electronics & Semiconductors KPI Dashboard in Excel—a complete performance management solution designed for managers, analysts, and leaders who want clear, data-driven insights without the need for expensive BI tools.
This dashboard is interactive, user-friendly, and cost-effective—perfect for organizations of any size looking to measure production efficiency, sales growth, inventory health, and financial performance in one place. Electronics & Semiconductors KPI Dashboard in Excel Whether you are running a startup or managing a global enterprise, this template makes KPI tracking simple, transparent, and actionable. 🚀
✨ Key Features of Electronics & Semiconductors KPI Dashboard in Excel
✔ 7 Structured Worksheets – Includes Home, Dashboard, KPI Trend, Actual Numbers Input, Target, Previous Year Numbers, and KPI Definition for complete performance management.
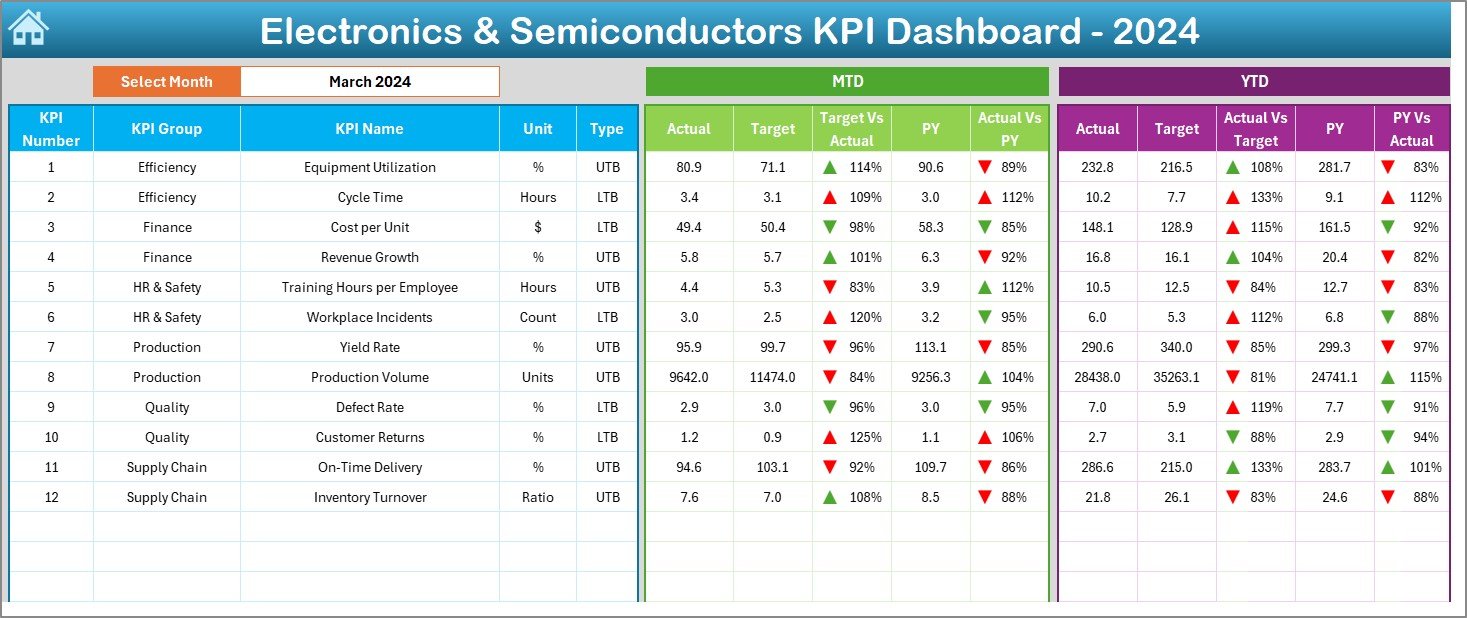
✔ Interactive Dashboard View – Month selector updates all KPIs instantly, displaying MTD, YTD, Targets, and Previous Year comparisons.
✔ Trend Tracking – KPI Trend sheet offers dropdown-based selection with detailed MTD & YTD charts, formulas, and definitions.
✔ Data Entry Simplified – Input sheets for Actuals, Targets, and Previous Year data keep reporting consistent and transparent.
✔ Conditional Formatting Arrows – Instantly visualize performance improvements or declines.
✔ Audit-Friendly Definitions – KPI Definition sheet ensures everyone in the company measures metrics the same way.
✔ Fully Customizable – Add KPIs, formulas, visuals, or department-specific sheets to meet unique business needs.
📂 What’s Inside the Electronics & Semiconductors KPI Dashboard
🔹 Home Sheet – Centralized navigation hub with buttons to jump directly to sections.
🔹 Dashboard Sheet – The heart of the file, showing real-time performance with MTD & YTD metrics.
🔹 KPI Trend Sheet – Drill into individual KPIs with dropdowns and trendline visuals.
🔹 Actual Numbers Input – Enter real performance numbers dynamically with month selection.
🔹 Target Sheet – Store benchmarks and planned values for KPI comparison.
🔹 Previous Year Numbers – Maintain last year’s data for growth and historical context.
🔹 KPI Definition Sheet – Keep formulas, units, and definitions standardized across the organization.
🛠️ How to Use the Electronics & Semiconductors KPI Dashboard
-
Download the Template – Open in Excel, no technical skills needed.
-
Enter Data – Fill in Actual, Target, and Previous Year numbers.
-
Select Month – Use the dropdown in the Dashboard sheet to update all results.
-
Analyze Trends – Switch KPIs in the KPI Trend sheet for detailed visual insights.
-
Compare Results – Review performance against Targets and Previous Year instantly.
-
Review & Share – Present dashboards during management meetings or audits with confidence.
👥 Who Can Benefit from This Template?
✅ Production Managers – Monitor efficiency, defects, and machine utilization.
✅ Sales Teams – Track revenue growth, market share, and sales targets.
✅ Supply Chain Managers – Control inventory turnover, stock shortages, and delivery metrics.
✅ Finance Leaders – Evaluate costs, margins, and ROI.
✅ Executives & Business Owners – Get a 360° view of business health in one file.
✅ Startups & SMEs – Affordable alternative to complex BI software.
✅ Large Enterprises – Department-level KPI tracking with centralized reporting.
With this dashboard, businesses can:
💡 Consolidate KPIs into one central file.
💡 Compare Actual vs Target vs Previous Year in seconds.
💡 Identify performance gaps with trendlines and arrows.
💡 Save time with prebuilt formulas and dynamic controls.
💡 Make smarter, faster, and data-driven decisions.
This isn’t just an Excel file—it’s a business growth accelerator for the electronics and semiconductor industry. 🌟















Reviews
There are no reviews yet.