The electronics retail industry never stands still. Prices change fast, trends shift quickly, and competition gets stronger every day. To stay ahead, retailers need a clear, real-time view of their performance—without complicated tools or expensive systems. That’s exactly what the Electronics Retail Dashboard in Excel delivers. This powerful, ready-made dashboard brings all your retail KPIs together so you can make smarter decisions in minutes, not hours.
Whether you operate a single electronics store or manage multiple locations, this Excel dashboard gives you instant visibility into sales, profits, returns, customer ratings, category performance, regional trends, and much more. It is built using structured tables, slicers, formulas, and interactive visuals—so all you need to do is paste your data into the Data Sheet, refresh once, and you’re ready to analyze your business like a pro.
Let’s explore how this dashboard turns raw numbers into meaningful insights.
⚡ Key Features of the Electronics Retail Dashboard in Excel
This dashboard is designed to give electronics retailers complete clarity through interactive visuals and dynamic analysis.
⭐ Ready-to-Use KPI Cards
Instantly track Gross Sales, Net Sales, Profit, Customer Ratings, and Return Order %.
⭐ Page Navigator
A left-side Page Navigator helps you switch between analysis pages within seconds.
⭐ Smart Slicers
Filter data by month, region, store, category, or sales channel to get deeper insights.
⭐ Clean, Visual Reporting
All charts, KPIs, and tables are displayed in an easy-to-understand format.
⭐ Automated Updates
Paste your data → refresh → the entire dashboard updates instantly.
📦 What’s Inside the Electronics Retail Dashboard in Excel
The dashboard includes five analytical pages, each providing a complete view of your business.
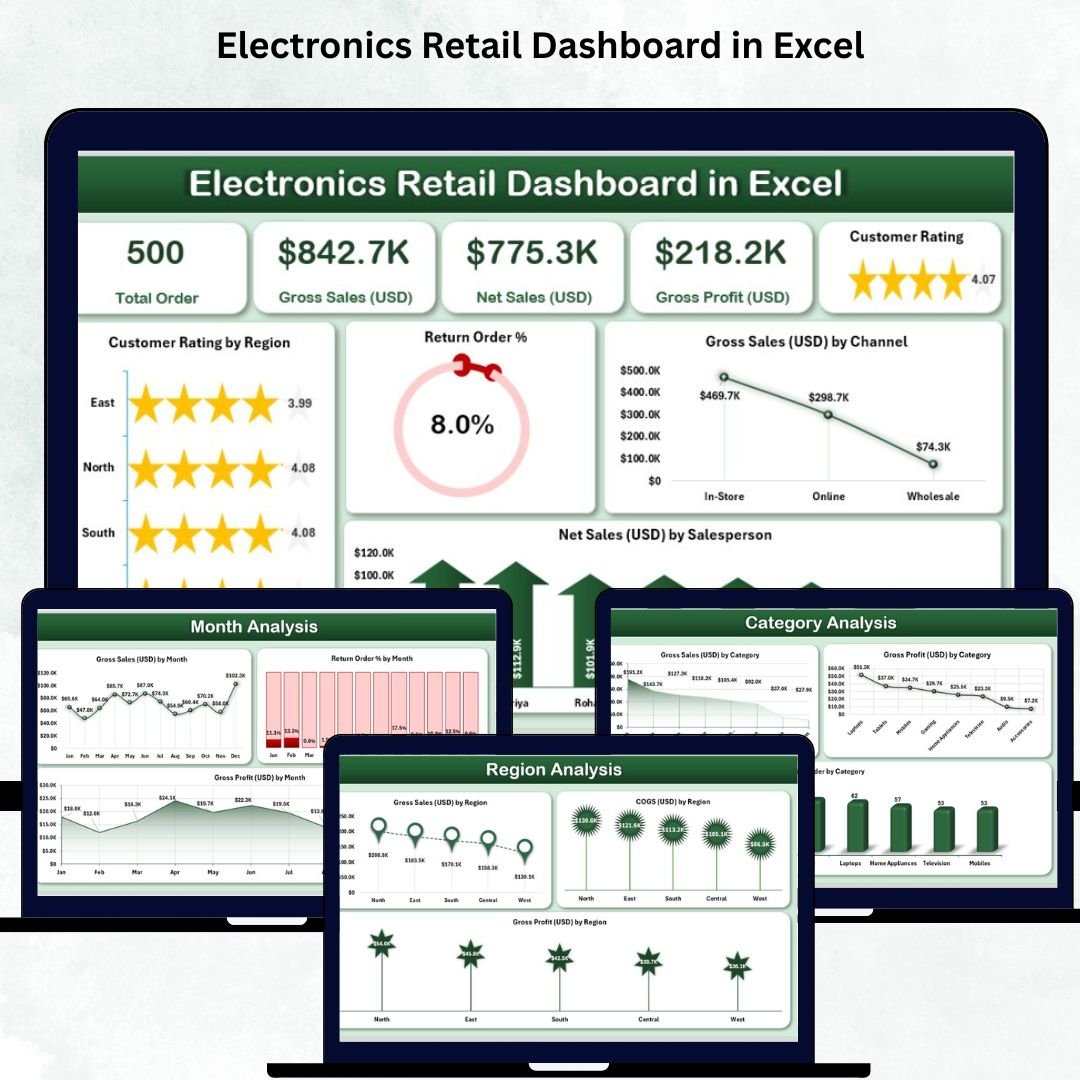
1️⃣ Overview Page
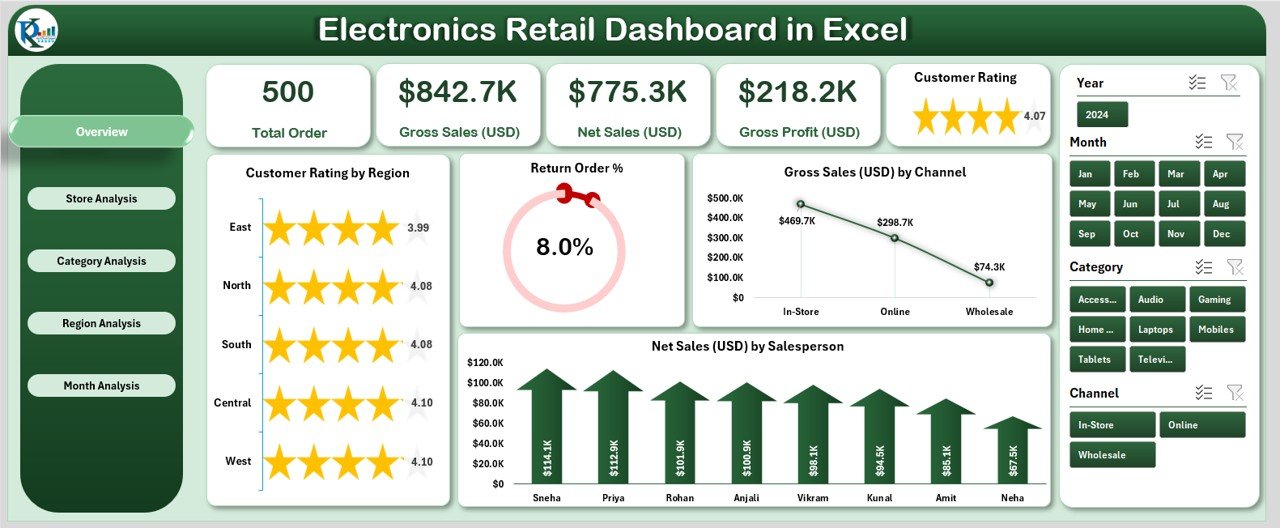
Your central performance hub. This page showcases:
✔ Gross Sales, Net Sales, Profit Insights, Return % & Customer Ratings
✔ Customer Rating by Region
✔ Return Order %
✔ Gross Sales by Channel
✔ Net Sales by Salesperson
This page shows exactly how your business is performing today, helping you detect issues early and take quick action.
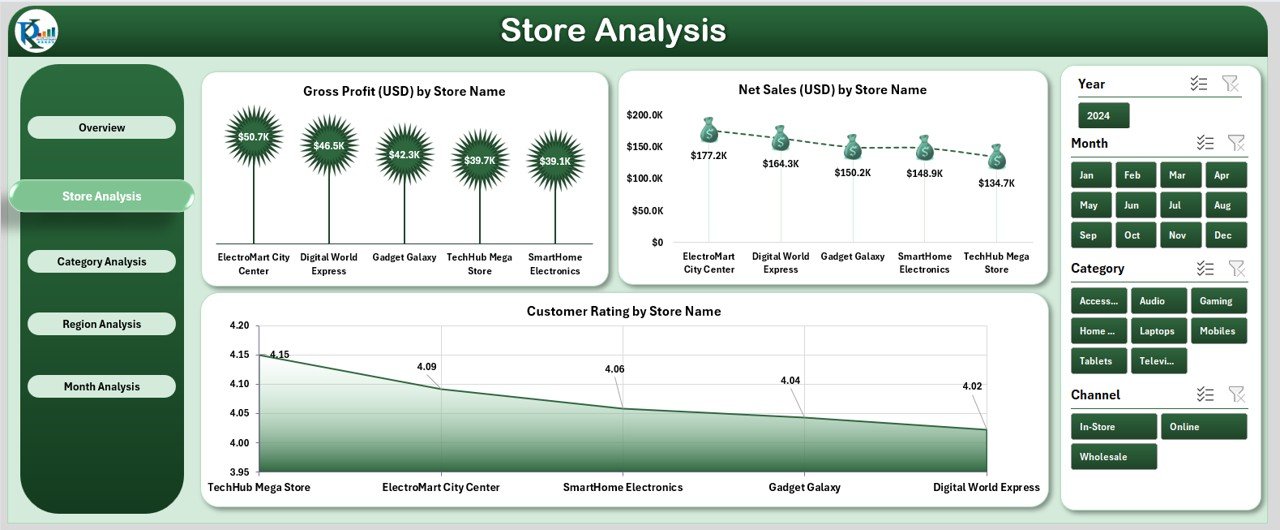
2️⃣ Store Analysis
Understand store-level performance and compare branches effortlessly. This page features:
✔ Profit by Store
✔ Return Order % by Store
✔ Customer Rating by Store
✔ Revenue vs Total Cost by Store
Use these insights to improve store operations, customer experience, and staff performance.
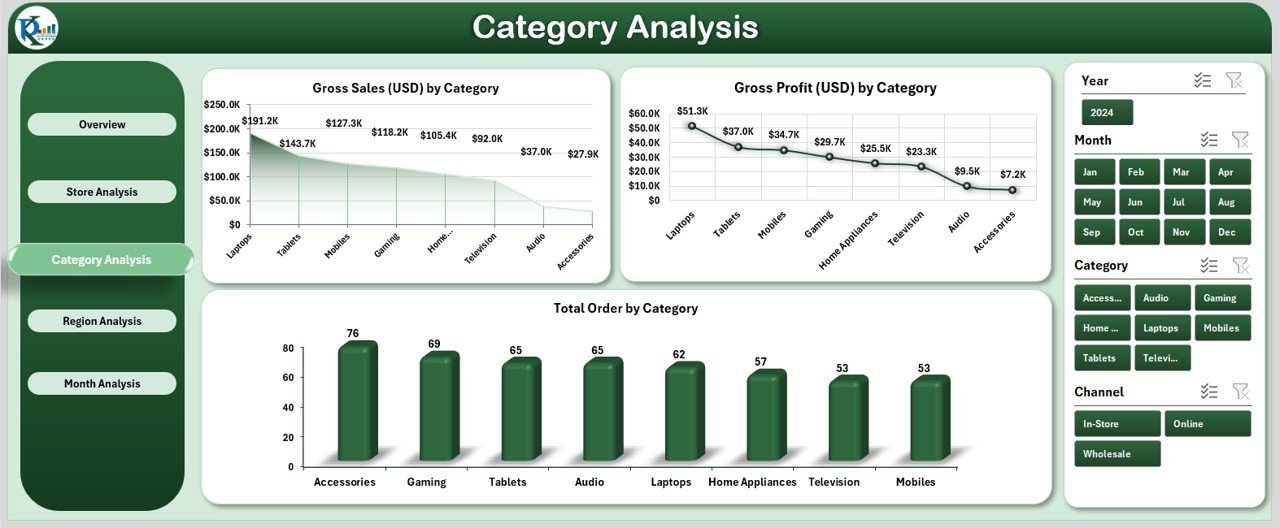
3️⃣ Category Analysis
Find out which electronics categories drive your business growth. This page includes:
✔ Gross Profit by Category
✔ Total Orders by Category
✔ Side-by-side Profit Charts for Detailed Comparison
Perfect for product managers, buyers, and planners who need fast category insights.
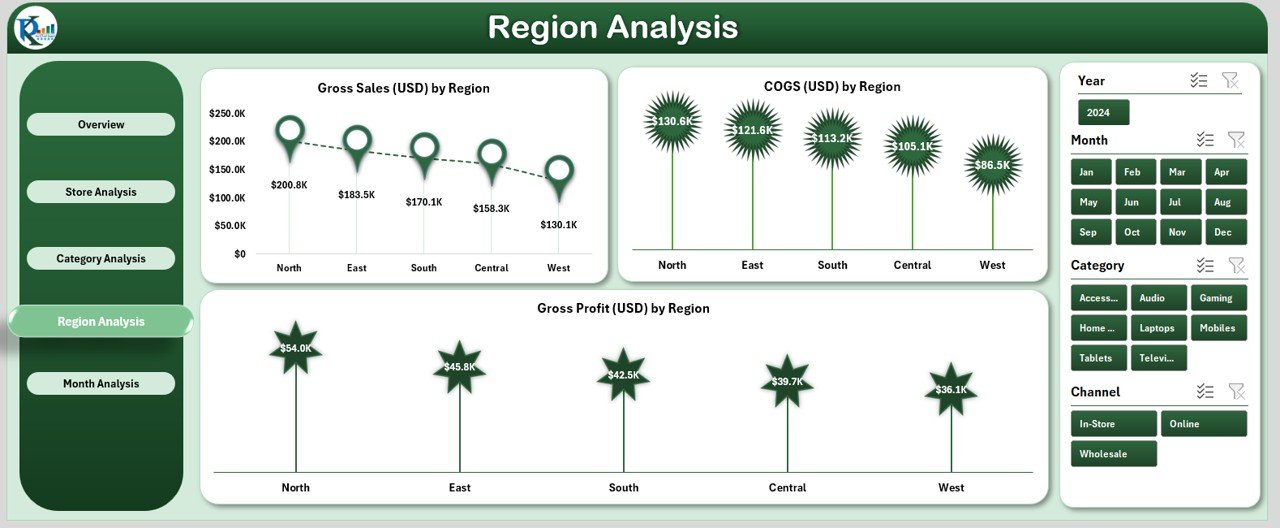
4️⃣ Region Analysis
Track region-wise performance with:
✔ Gross Profit by Region
✔ COGS by Region
✔ Comparative Profit Charts
Identify untapped opportunities and understand market-level trends easily.
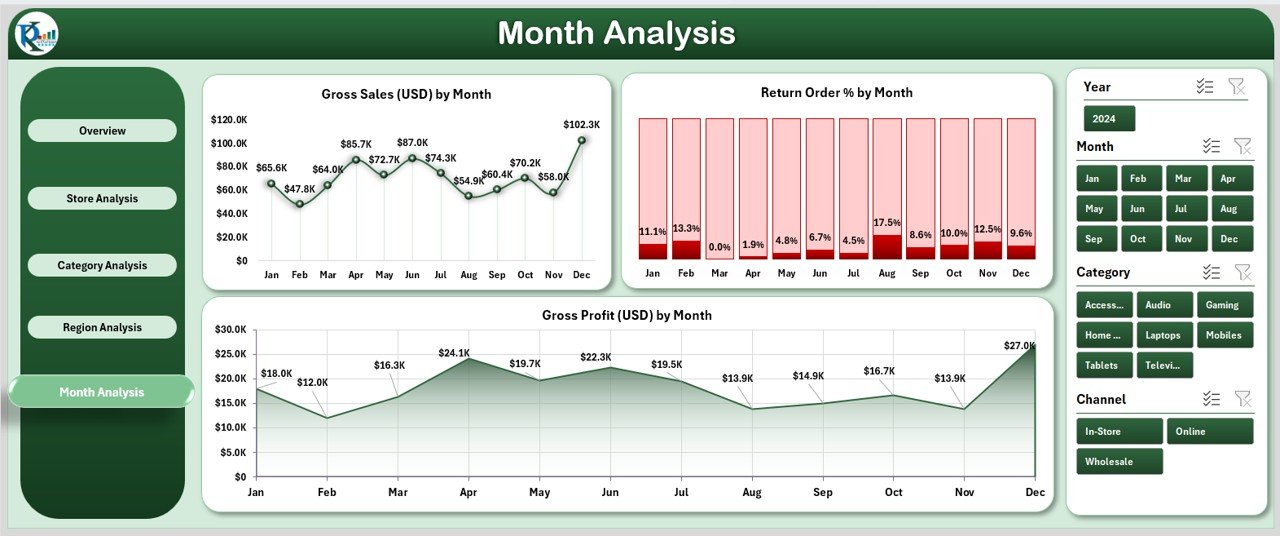
5️⃣ Month Analysis
Understand month-over-month changes with:
✔ Gross Profit by Month
✔ Return Order % by Month
✔ Seasonal Trend Comparisons
These visuals help in forecasting, budgeting, and inventory planning.
🛠️ How to Use the Electronics Retail Dashboard in Excel
Using this dashboard is extremely simple:
✔ Step 1
Paste your raw sales, cost, rating, and return data into the Data Sheet.
✔ Step 2
Click Refresh.
✔ Step 3
Use slicers to filter by store, region, category, or month.
✔ Step 4
Review KPIs and charts to identify growth opportunities.
✔ Step 5
Use monthly and regional insights for strategic planning.
No macros, no coding, no extra software needed.
👥 Who Can Benefit from This Dashboard
This dashboard is ideal for:
✔ Electronics retail owners
✔ Store managers
✔ Category managers
✔ Regional managers
✔ Inventory planners
✔ Finance teams
✔ Multi-store chains
✔ Online + offline retailers
Anyone involved in sales, planning, or decision-making can use this dashboard confidently.
### 🔗 Click Here to Read the Detailed Blog Post
📺 Visit our YouTube channel to learn step-by-step video tutorials
👉 https://www.youtube.com/@PKAnExcelExpert


Reviews
There are no reviews yet.