Managing electricity tenders without clear performance visibility is risky, expensive, and inefficient. Because electricity tenders involve high contract values, strict compliance requirements, long execution cycles, and multiple stakeholders, even a minor delay or KPI miss can lead to serious financial and operational consequences.
That is exactly why the Electricity Tender KPI Dashboard in Power BI is designed as a powerful, ready-to-use performance monitoring solution.
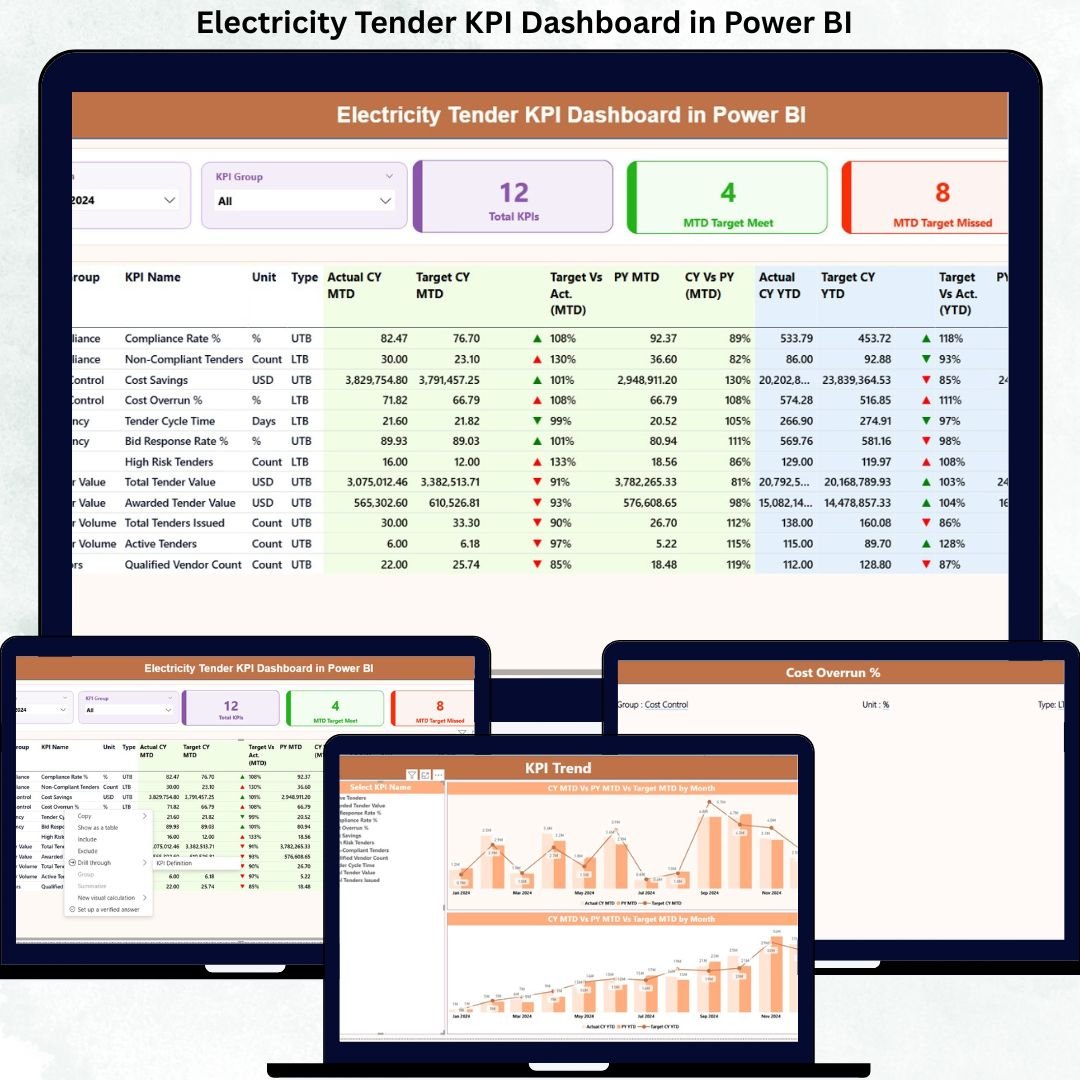
This dashboard converts raw tender KPI data into clear, interactive, and actionable insights. Instead of working with scattered Excel files and manual reports, decision-makers get a centralized Power BI dashboard that highlights target achievement, performance gaps, trends, and accountability—all in real time.
Built with simplicity and scalability in mind, this dashboard uses Excel as the data source and Power BI for analytics, making it easy for both technical and non-technical users to adopt. Whether you manage government electricity tenders or private utility projects, this dashboard ensures transparency, control, and confidence in every decision.
⚡ Key Features of Electricity Tender KPI Dashboard in Power BI
📊 Centralized KPI Monitoring – Track all electricity tender KPIs in one interactive Power BI dashboard instead of multiple disconnected files.
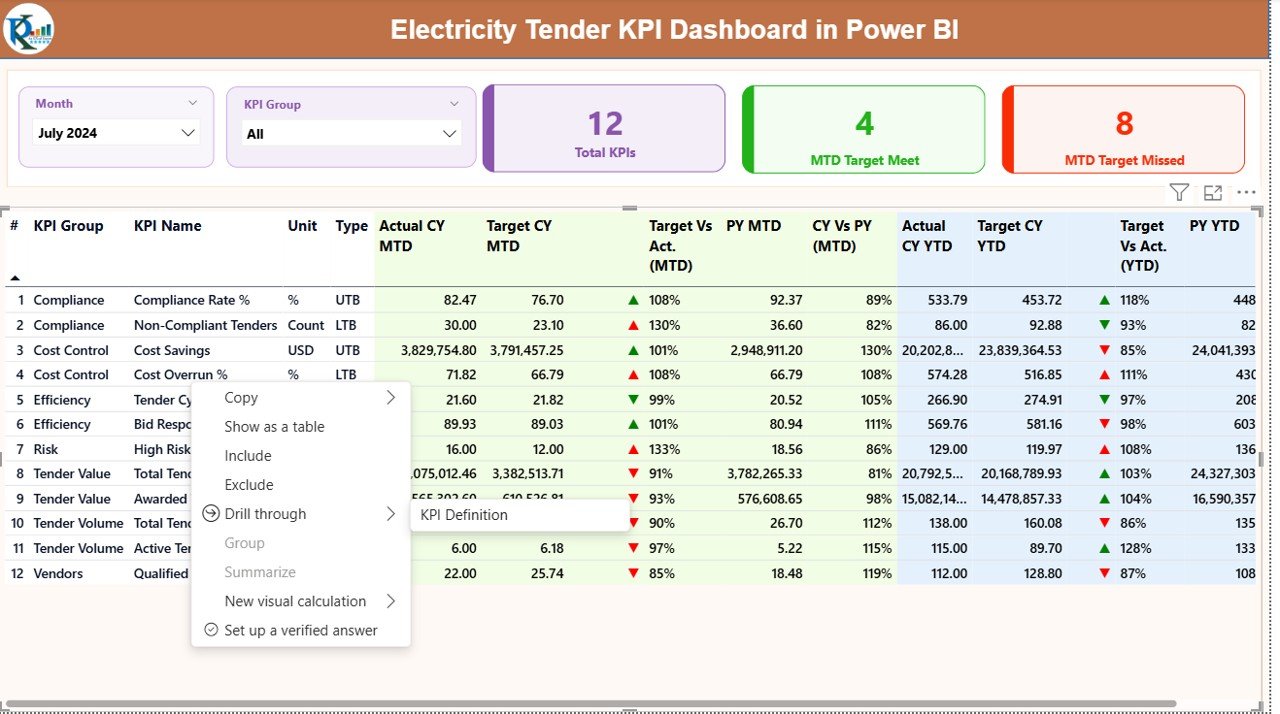
📅 Dynamic Month & KPI Group Slicers – Instantly filter performance by month and KPI category for focused analysis.
🎯 MTD & YTD Performance Analysis – Monitor both short-term and cumulative performance with automated calculations.
📈 Target vs Actual Comparison – Identify target-met and target-missed KPIs instantly using variance indicators.
🔄 Previous Year Comparison – Measure growth or decline with CY vs PY analysis for better benchmarking.
🚦 Visual Performance Indicators – Green and red icons make performance gaps visible at a glance.
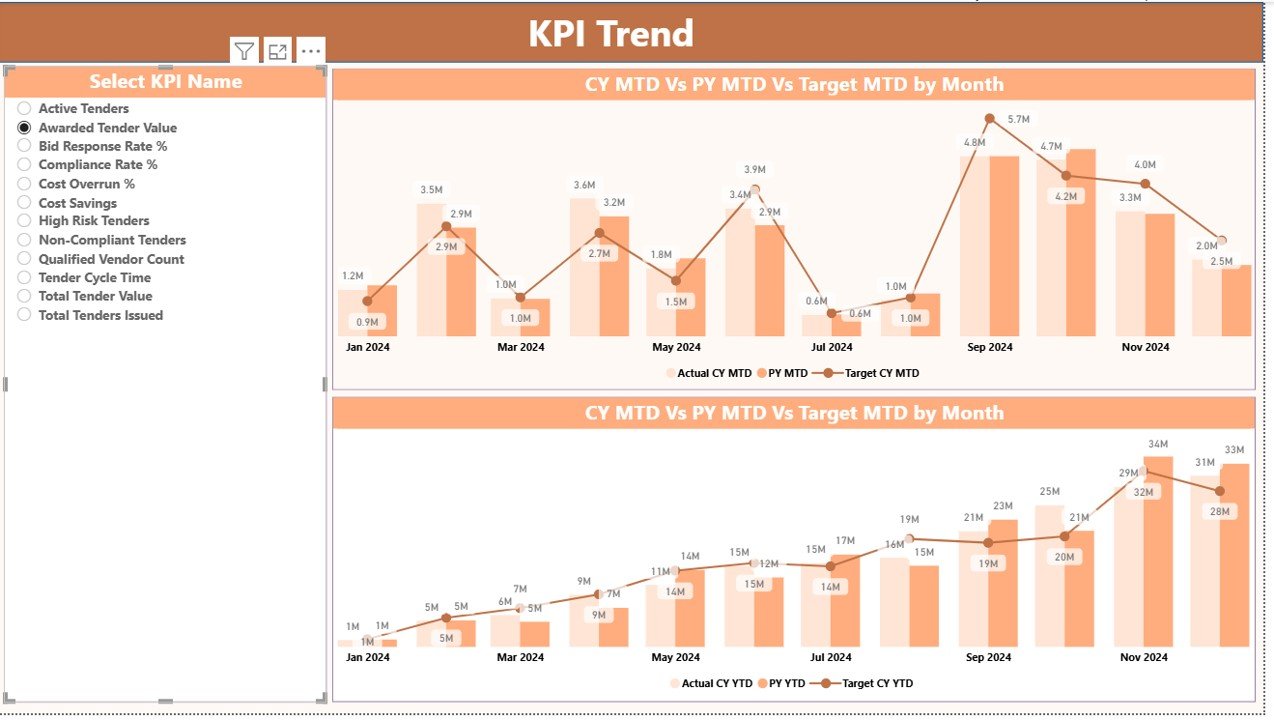
📉 Trend Analysis Charts – Analyze KPI behavior over time using interactive MTD and YTD trend visuals.
📁 Excel-Driven Data Model – Simple Excel input structure keeps data management easy and flexible.
📦 What’s Inside the Electricity Tender KPI Dashboard in Power BI
This digital product includes a fully structured Power BI report with three powerful analytical pages:
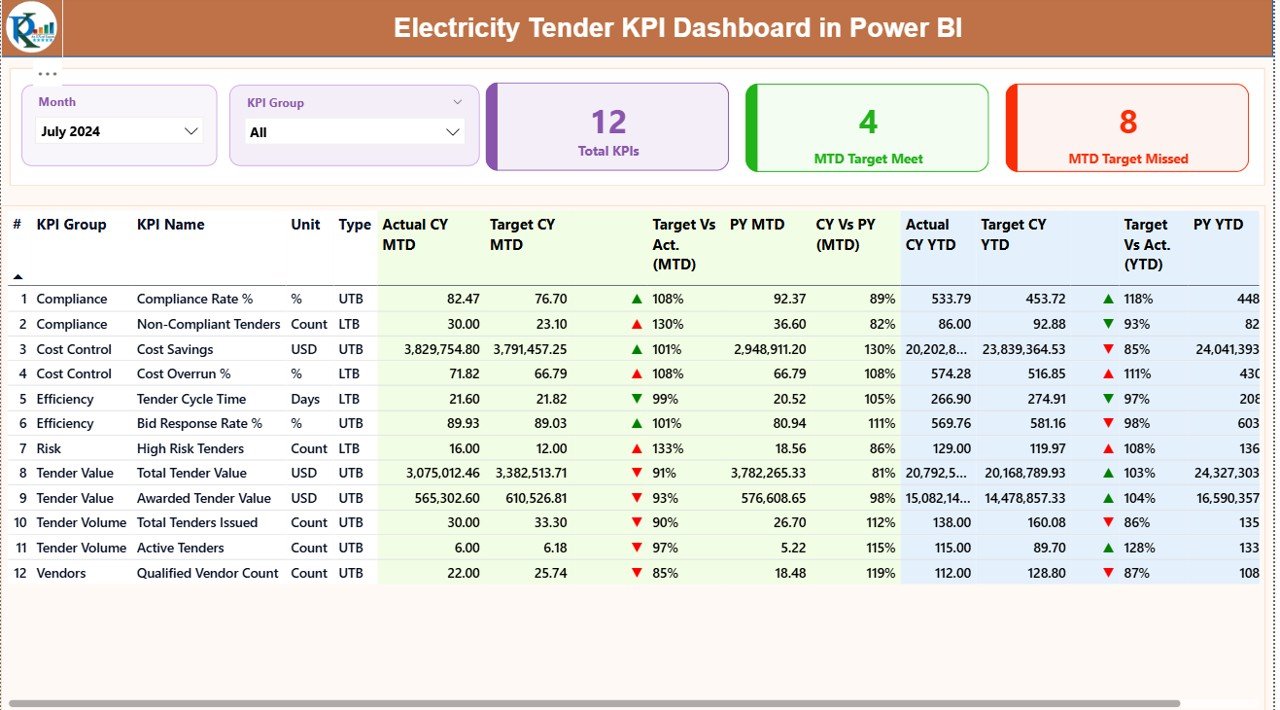
✔️ Summary Page
A high-level performance snapshot with KPI cards, slicers, and a detailed KPI table showing MTD and YTD performance, targets, and previous year comparisons.
✔️ KPI Trend Page
Interactive combo charts that display MTD and YTD trends for Actual, Target, and Previous Year values—perfect for performance tracking over time.
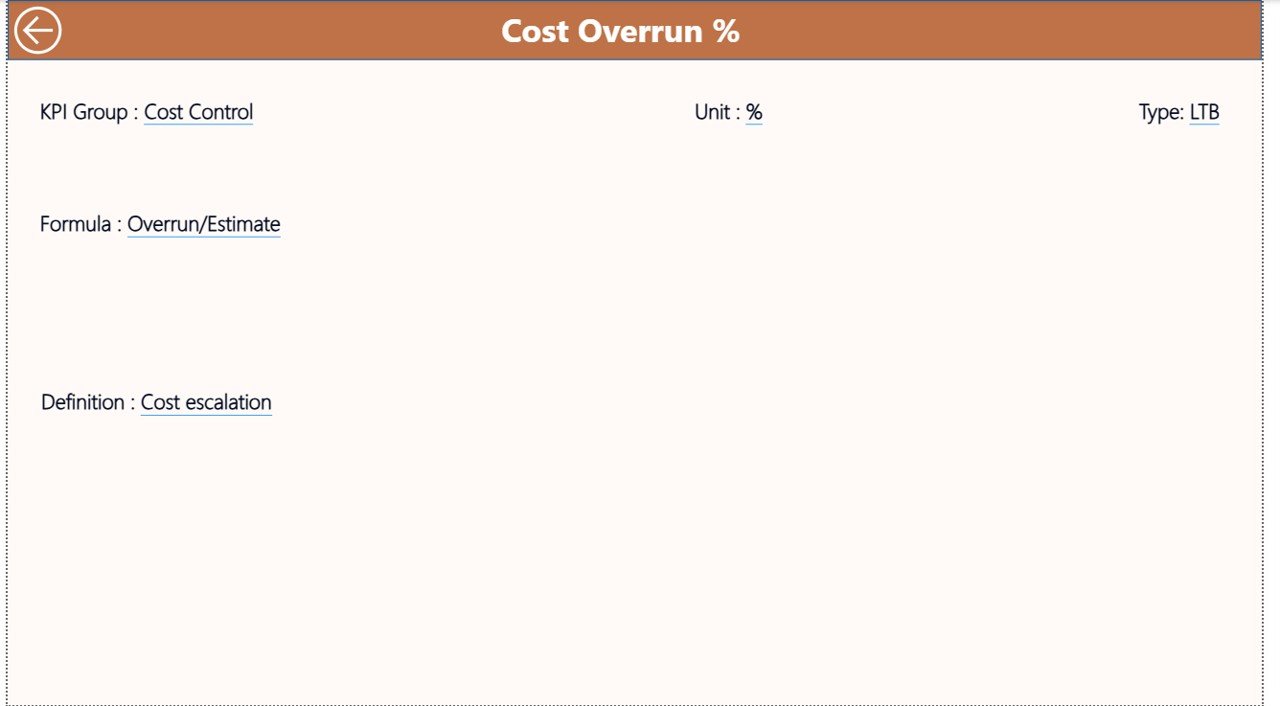
✔️ KPI Definition Page
A drill-through page that clearly explains KPI formulas, definitions, units, and KPI types (LTB or UTB), ensuring clarity and consistency.
You also get a structured Excel data source with separate sheets for Actual values, Target values, and KPI definitions.
🛠️ How to Use the Electricity Tender KPI Dashboard in Power BI
Using this dashboard is simple and user-friendly:
1️⃣ Enter actual KPI values in the Input_Actual Excel sheet
2️⃣ Enter target KPI values in the Input_Target Excel sheet
3️⃣ Define KPIs clearly in the KPI Definition sheet
4️⃣ Refresh the Power BI file
5️⃣ Use slicers to analyze MTD, YTD, trends, and comparisons instantly
No advanced Power BI knowledge is required. If you can update Excel, you can use this dashboard confidently.
👥 Who Can Benefit from This Electricity Tender KPI Dashboard in Power BI
This dashboard is ideal for:
⚡ Electricity Boards and Utilities
🏭 Power Generation, Transmission & Distribution Companies
🏗️ EPC Contractors handling electricity projects
🏛️ Government Tender Authorities
📊 Energy Project Managers and Analysts
💰 Finance and Compliance Teams
Because it is scalable and flexible, the dashboard works equally well for public-sector and private-sector electricity tenders.
Click here to read the Detailed blog post
Watch the step-by-step video tutorial:


Reviews
There are no reviews yet.