


In the education sector, measuring success goes far beyond classroom results. Schools, universities, training centers, and online learning platforms all rely on performance data to improve student outcomes, optimize resources, and streamline operations. Yet, manually tracking data through multiple spreadsheets and reports often leads to errors, delays, and missed opportunities.
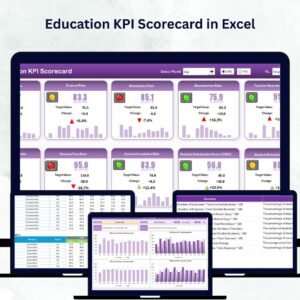
The Education Services KPI Dashboard in Excel solves this problem by providing a centralized, automated, and visual tool for performance management. With built-in charts, slicers, and conditional formatting, this dashboard transforms raw data into actionable insights—helping administrators and educators make smarter decisions, faster.
✨ Key Features of the Education Services KPI Dashboard

-
🏠 Home Sheet Navigation – A clean index page with six clickable buttons for instant access to all key sections.
-
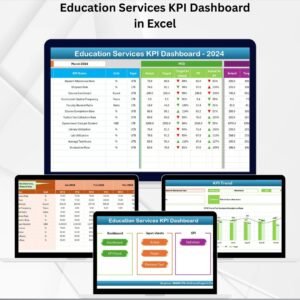
📊 Dashboard Sheet – Displays MTD (Month-to-Date) and YTD (Year-to-Date) comparisons of Actual vs Target vs Previous Year. Uses automatic green ▲ and red ▼ arrows for quick interpretation.
-
📈 KPI Trend Sheet – Select any KPI from a drop-down menu and analyze trend charts over time. See Actuals, Targets, and Previous Year numbers side by side.
-
📝 Actual Numbers Input Sheet – Input current performance values (both MTD and YTD). Includes a flexible start-month option, ideal for academic calendars.
-
🎯 Target Sheet – Define monthly and yearly benchmarks for every KPI.
-
📆 Previous Year Numbers Sheet – Store and compare historical data to identify long-term growth trends.
-
📚 KPI Definition Sheet – A master list of all KPIs with columns for KPI Name, Group, Unit, Formula, and Definition. Ensures consistency across reporting.
📦 What’s Inside the Dashboard
-
Centralized Home Sheet – Quick navigation buttons.
-
Dynamic Dashboard – Visual overview of all KPIs.
-
KPI Trend Analysis – Track performance patterns.
-
Input Sheets – Enter Actual, Target, and Previous Year values.
-
KPI Master List – Clear, standardized KPI definitions.
🛠️ How to Use the Dashboard
-
Start with the Home Sheet – Choose your desired section.
-
Set the First Month – Adjust the start of the reporting cycle.
-
Enter Target Data – Add monthly and yearly benchmarks in the Target Sheet.
-
Add Actual Data – Record results in the Actual Numbers Input Sheet.
-
View Performance – Select a month on the Dashboard to update KPIs instantly.
-
Analyze Trends – Use the KPI Trend Sheet for deeper analysis.
-
Compare with Past Years – Leverage the Previous Year Numbers sheet for historical insights.
👥 Who Can Benefit from This Dashboard?
-
🎓 Universities & Colleges – Monitor faculty performance, student enrollment, and research outcomes.
-
🏫 Schools – Track attendance, test scores, and parent satisfaction.
-
🏢 Training Institutes – Measure course completion rates and instructor effectiveness.
-
💻 E-Learning Platforms – Evaluate engagement, drop-off rates, and revenue per student.
🎯 Advantages of Education Services KPI Dashboard in Excel
-
✅ Centralized Reporting – All performance data in one place.
-
✅ Time-Saving – Automated calculations reduce manual work.
-
✅ Data-Driven Decisions – Real-time insights for smarter strategies.
-
✅ Customizable – Add or modify KPIs to fit your institution.
-
✅ Visual Clarity – Charts and conditional formatting highlight trends instantly.
-
✅ Historical Comparison – Easily track progress against previous years.
-
✅ User-Friendly – Requires only basic Excel knowledge.
🚀 Opportunities for Improvement
-
🔗 Integrate with LMS – Automate data updates from learning systems.
-
⏱️ Real-Time Data Connections – Use Power Query or SQL for live updates.
-
💬 Add Survey Insights – Incorporate student and faculty feedback.
-
📊 Forecasting Features – Predict enrollment and retention trends.
-
🧑🏫 Expanded KPIs – Add research performance, grant tracking, and faculty development metrics.
🏆 Best Practices for Using the Dashboard
-
Define KPIs clearly in the KPI Definition Sheet.
-
Double-check inputs for accuracy.
-
Update monthly for consistency.
-
Use conditional formatting to highlight trends.
-
Share insights with stakeholders regularly.
-
Align KPIs with institutional goals.
-
Analyze both monthly and yearly trends for long-term improvement.
🌍 Real-World Use Cases
-
Universities: Monitor research funding, faculty workload, and student retention.
-
Schools: Track academic performance and satisfaction.
-
Training Centers: Evaluate instructor productivity and course completion rates.
-
Online Learning Platforms: Measure engagement, revenue per student, and dropout rates.


Reviews
There are no reviews yet.