In today’s fast-paced digital learning environment, data is the backbone of success. From online academies to mobile learning apps, educational organizations need to measure performance, engagement, and revenue effectively to stay competitive. The E-Learning Apps Dashboard in Excel provides a comprehensive, ready-to-use solution to manage and analyze all these metrics — without expensive software or technical complexity.
This interactive Excel dashboard consolidates all your key performance indicators (KPIs) — such as total users, study hours, revenue, satisfaction ratings, and subject performance — into one visual, dynamic workspace. Built entirely in Microsoft Excel, it turns raw e-learning data into actionable insights that help educators, developers, and business owners make smarter, faster decisions.
⚙️ Key Features of the E-Learning Apps Dashboard in Excel
📊 Five Analytical Pages – Overview, App Name Analysis, Country Analysis, Subject Analysis, and Monthly Trends for deep insights.
🎯 KPI Cards – Track total users, lessons completed, study hours, total revenue, and average app rating.
🌍 Geographic Analysis – Compare regional engagement, payments, and performance by country.
📈 Subject-Level Insights – Evaluate course popularity, completion rates, and learner engagement by subject.
💳 Revenue Analysis – Measure amount paid by user type, app, or region to monitor profitability.
📅 Monthly Trends View – Understand how performance evolves over time using dynamic charts.
🧭 Page Navigator – Jump between sections easily using interactive buttons on the left side.
💡 Right-Side Slicers – Filter data by month, subscription type, region, or app name for instant analysis.
📘 Data and Support Sheets – Keep your raw data and reference items organized for smooth automation.
💻 No Coding Required – Built 100% in Excel using formulas, pivot tables, and conditional formatting.
📂 Dashboard Structure and Pages
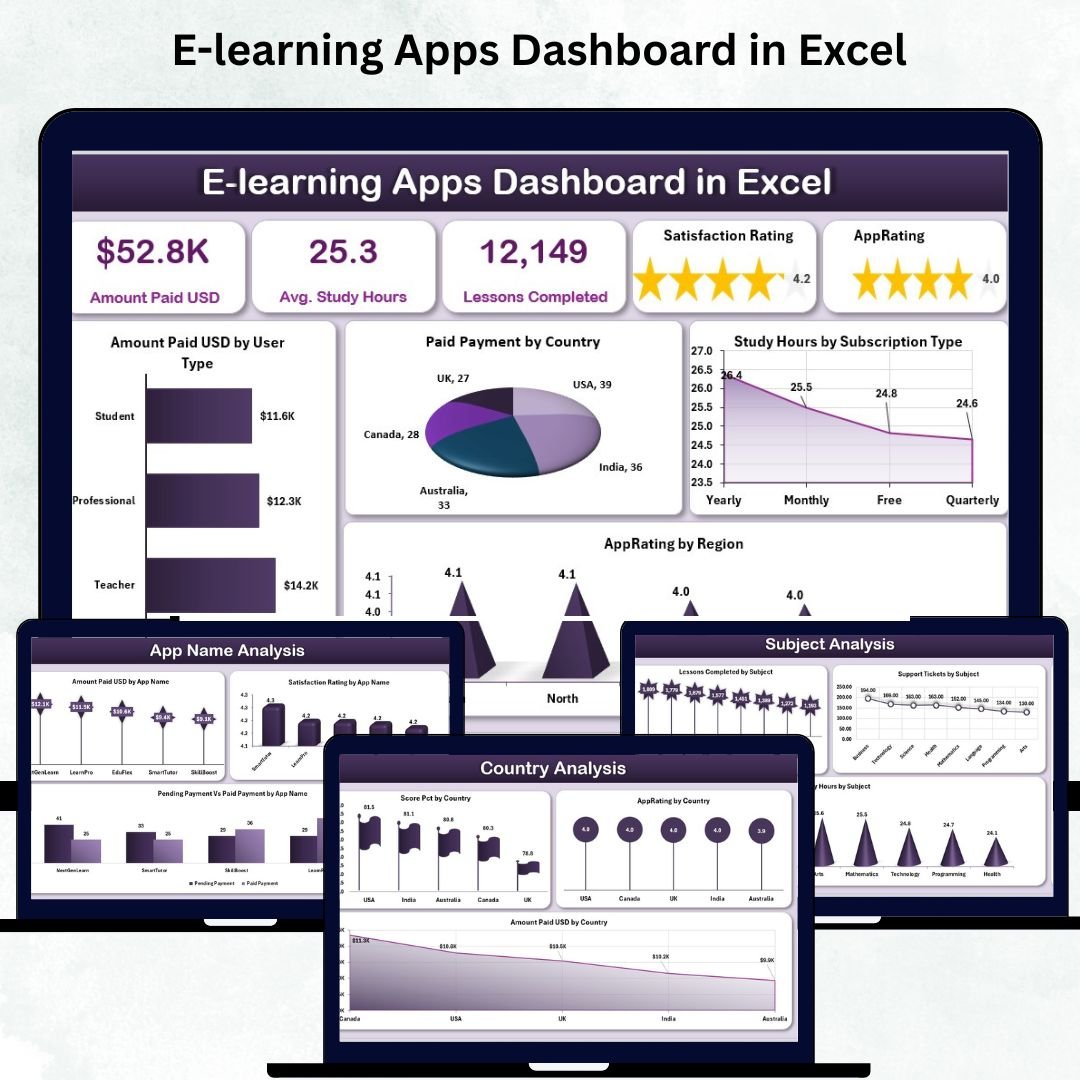
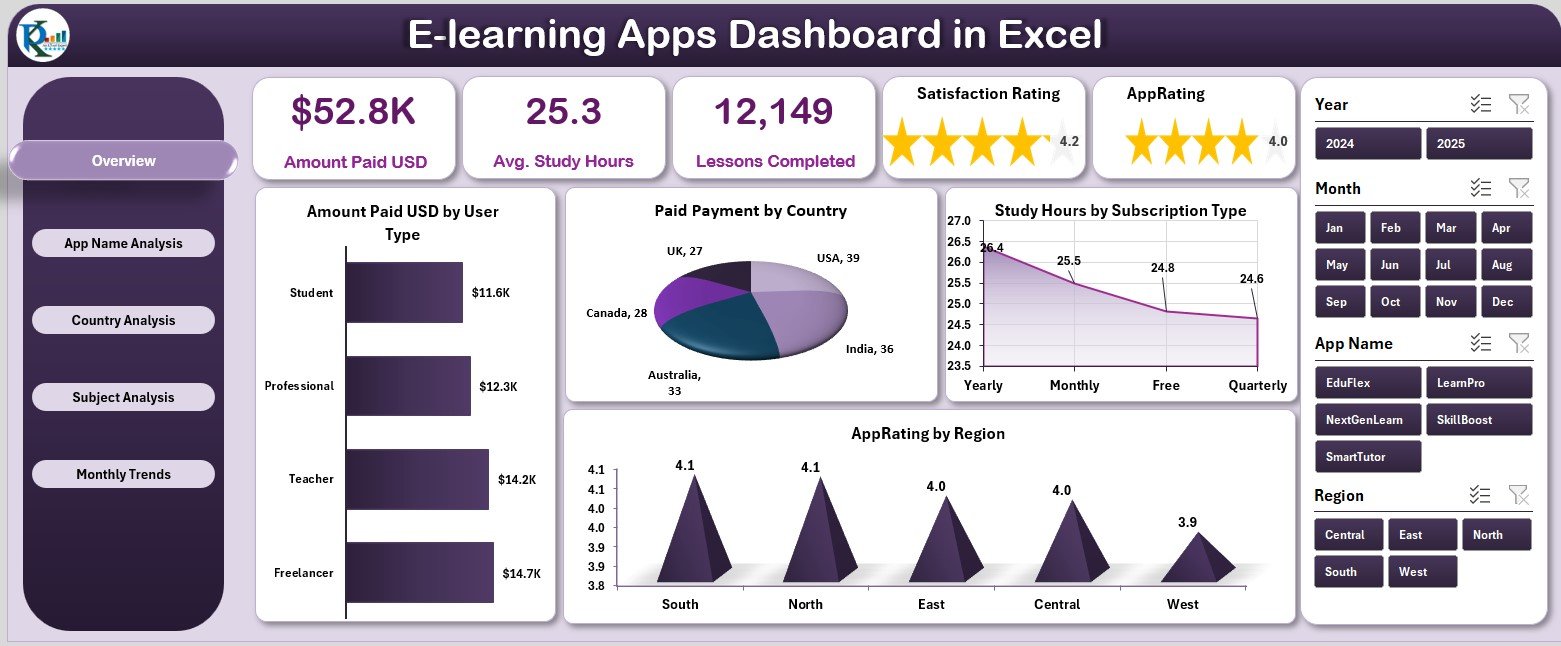
🏠 1️⃣ Overview Page – Your Control Center
The Overview Page provides a snapshot of key metrics.
It includes:
-
Right-side slicer panel for filtering by month or region.
-
Five KPI cards showing totals for revenue, users, study hours, and ratings.
-
Four interactive charts:
-
Amount Paid (USD) by User Type
-
Paid Payment by Country
-
Study Hours by Subscription Type
-
App Rating by Region
-
This gives a high-level summary of the app ecosystem and user engagement in real time.
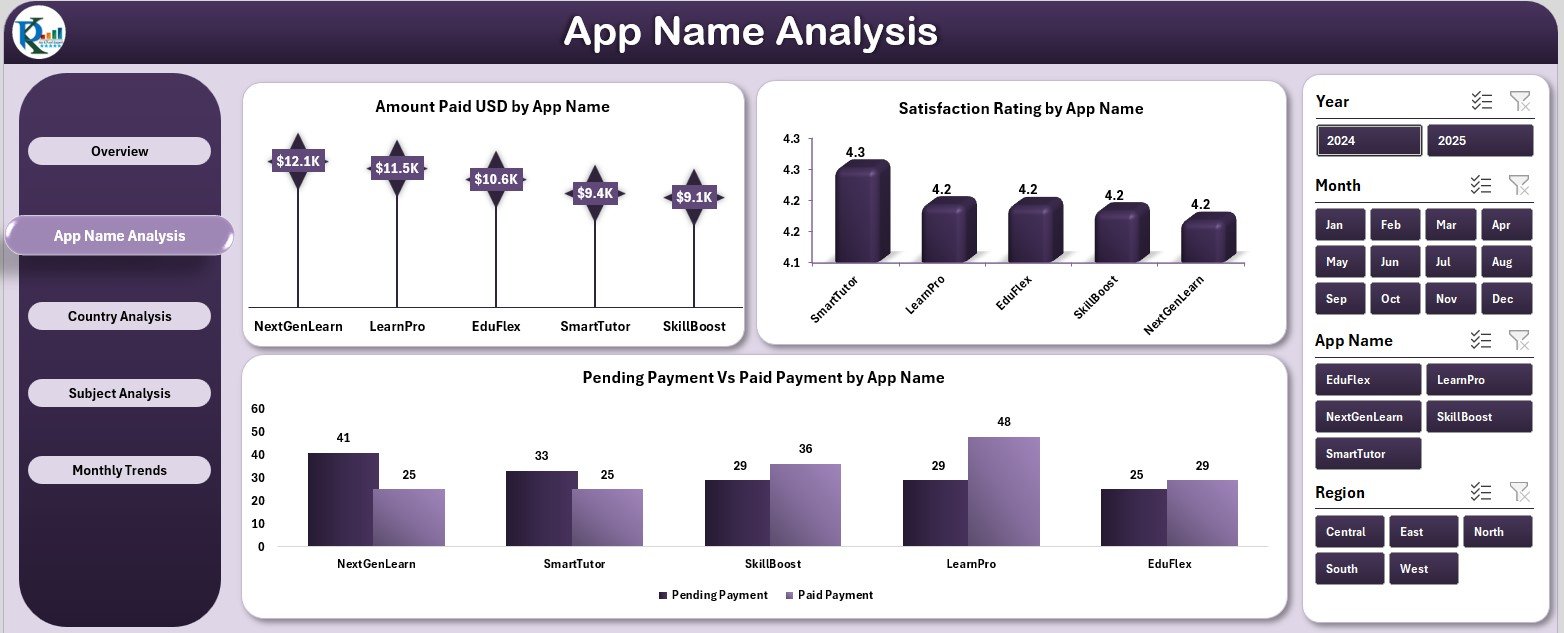
📱 2️⃣ App Name Analysis Page
Analyze how each e-learning app or platform performs.
Includes:
-
Slicer for filtering by app or time period
-
Charts for:
-
Amount Paid (USD) by App Name
-
Satisfaction Rating by App Name
-
Pending vs Paid Payment by App Name
-
Perfect for comparing performance across multiple platforms.
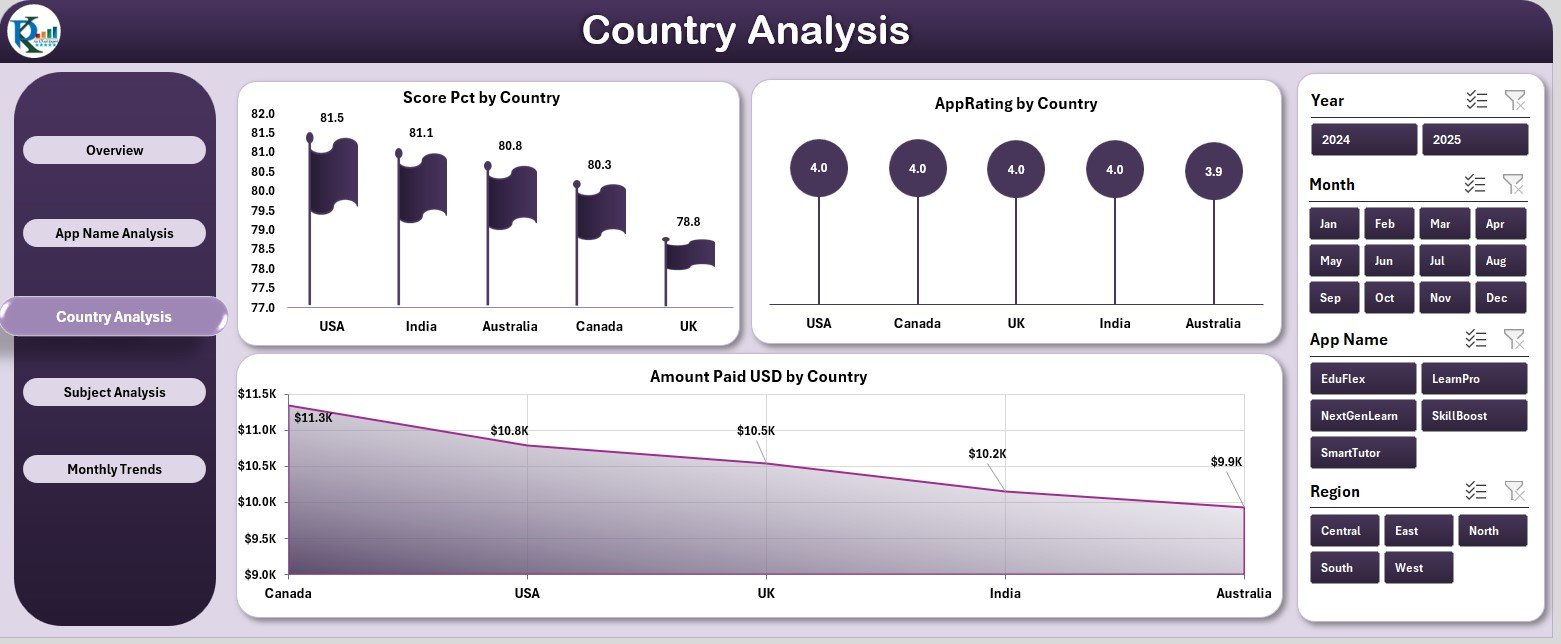
🌍 3️⃣ Country Analysis Page
Understand how your app performs globally.
Key visuals include:
-
Score Percentage by Country
-
App Rating by Country
-
Amount Paid (USD) by Country
These visuals help you identify high-performing markets and engagement opportunities.
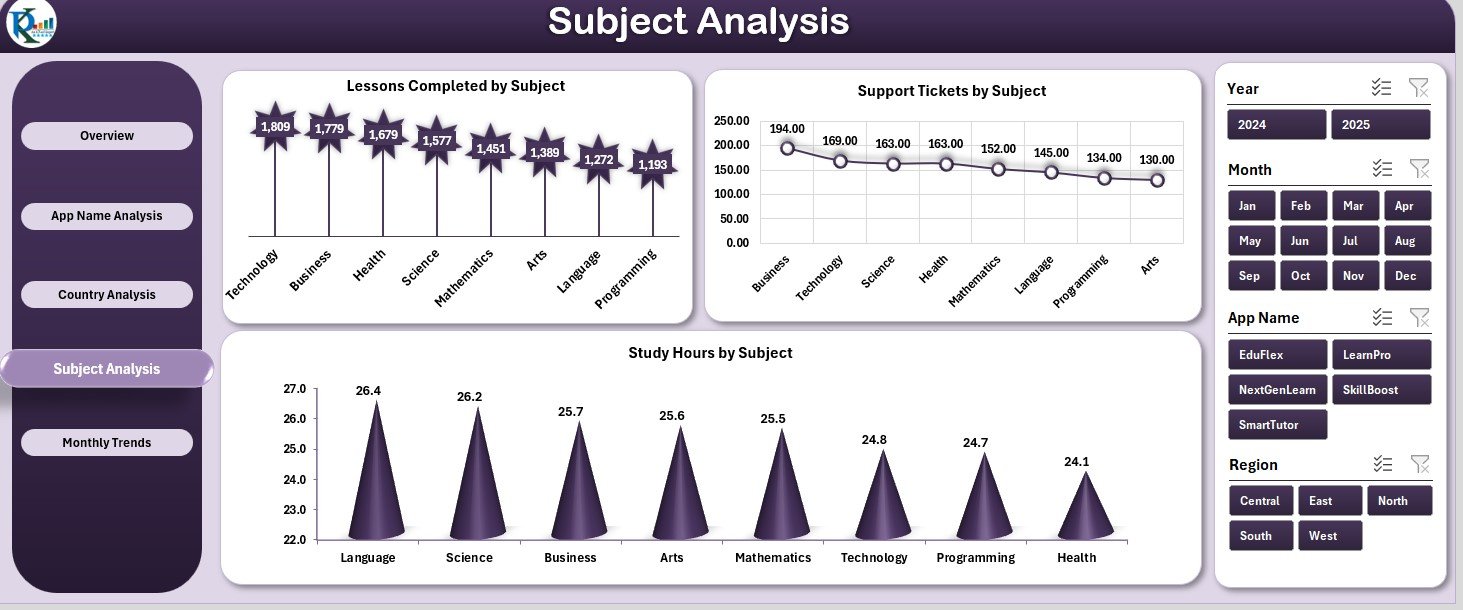
📚 4️⃣ Subject Analysis Page
Dive deep into course and subject-level data.
Charts include:
-
Lessons Completed by Subject
-
Support Tickets by Subject
-
Study Hours by Subject
This helps you identify which subjects engage learners the most and where improvements are needed.
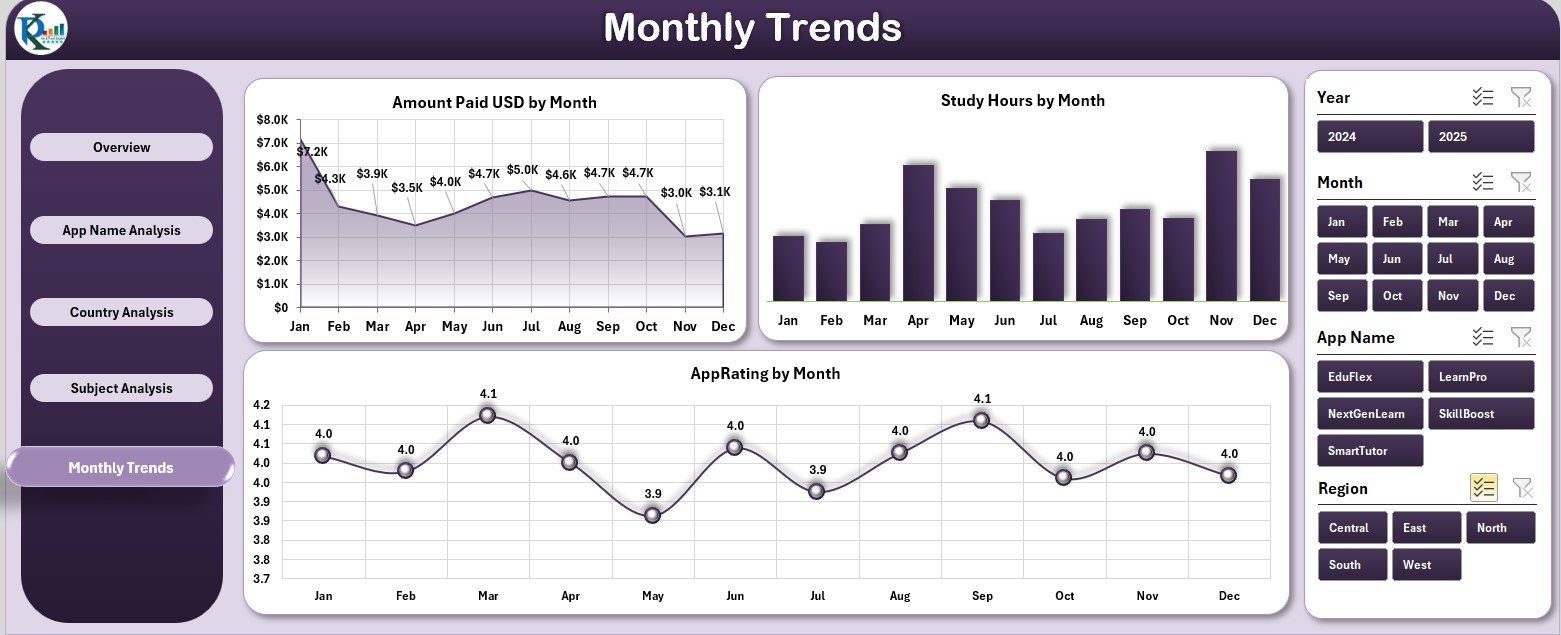
📅 5️⃣ Monthly Trends Page
Spot growth patterns and seasonal changes with time-based charts:
-
Amount Paid (USD) by Month
-
Study Hours by Month
-
App Rating by Month
Track ongoing user activity and satisfaction trends to make informed strategic decisions.
📊 Support and Data Sheets
-
Data Sheet: The engine that stores payment, usage, and feedback data.
-
Support Sheet: Houses static references like category names, color codes, and formulas.
🌟 Advantages of Using the E-Learning Apps Dashboard in Excel
✅ All-in-One Analytics – Consolidates learner, payment, and engagement data in one dashboard.
✅ Revenue Transparency – Instantly view income by app, country, or user type.
✅ Enhanced Learner Insights – Understand student activity and satisfaction trends.
✅ Global and Subject-Level View – Measure performance geographically and academically.
✅ Customizable and Scalable – Add new apps, countries, or subjects easily.
✅ Time-Saving Automation – Refresh data in seconds instead of hours.
✅ Data-Driven Strategy – Improve courses, marketing, and retention with real insights.
🧠 Best Practices for Use
📌 Update the Data Sheet monthly with new learner and payment data.
📌 Use consistent naming conventions for apps, subjects, and countries.
📌 Apply slicers to explore different scenarios and insights.
📌 Leverage conditional formatting to highlight key trends.
📌 Create backups to maintain historical analysis.
📌 Customize chart colors and branding to match your organization’s identity.
👥 Who Can Benefit
🎓 Educational Institutions – Monitor online learning metrics.
🏢 Corporate L&D Teams – Track training performance and completion rates.
💻 E-Learning App Developers – Assess platform usage and customer satisfaction.
📈 Consultants & Analysts – Evaluate KPIs for multiple clients or markets.
🌐 Course Creators & Entrepreneurs – Measure app success and identify profitable areas.


Reviews
There are no reviews yet.