
Derivatives trading is fast, complex, and high-risk. Traders, portfolio managers, and risk teams must continuously track performance, targets, and trends to stay profitable and compliant. However, when trading KPIs are spread across multiple Excel sheets, calculations become manual, insights get delayed, and decision-making suffers.
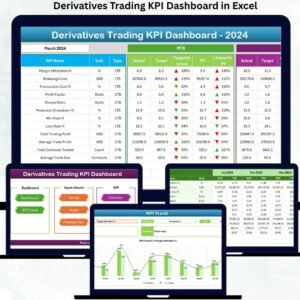
The Derivatives Trading KPI Dashboard in Excel solves this problem by converting raw derivatives trading data into clear, dynamic, and actionable performance insights—all inside Excel. Derivatives Trading KPI Dashboard in Excel This ready-to-use dashboard gives traders and leadership a single performance cockpit to track MTD, YTD, targets, previous-year comparisons, and trends without Power BI or coding.
Built entirely in Excel, this dashboard fits naturally into trading workflows. As a result, teams stop struggling with manual reporting and start focusing on strategy, risk control, and profitability.
🚀 Key Features of the Derivatives Trading KPI Dashboard in Excel
📊 Centralized Trading KPI Monitoring – Track all derivatives KPIs in one dashboard
📆 MTD & YTD Performance Tracking – Monitor short-term and long-term results together
🎯 Target vs Actual Analysis – Instantly see whether trading goals are met
📉 Previous Year Benchmarking – Compare current results with historical performance
🔔 Visual Performance Indicators – Green ▲ and red ▼ arrows for instant insights
📈 KPI-Level Trend Analysis – Identify patterns, volatility, and consistency
🧭 Easy Sheet Navigation – One-click buttons for smooth movement
🧠 100% Excel-Based Solution – No Power BI, no macros, no coding
📦 What’s Inside the Derivatives Trading KPI Dashboard
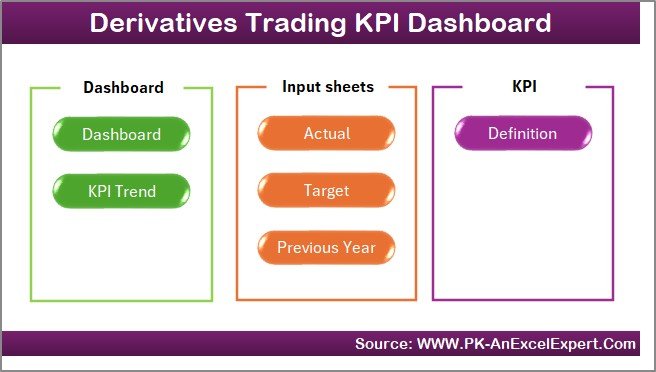
This Excel dashboard contains 7 structured and professionally designed worksheets, each serving a clear analytical purpose:
🏠 Home Sheet
Acts as an index page with six navigation buttons, allowing users to jump instantly to any dashboard section—no scrolling or confusion.
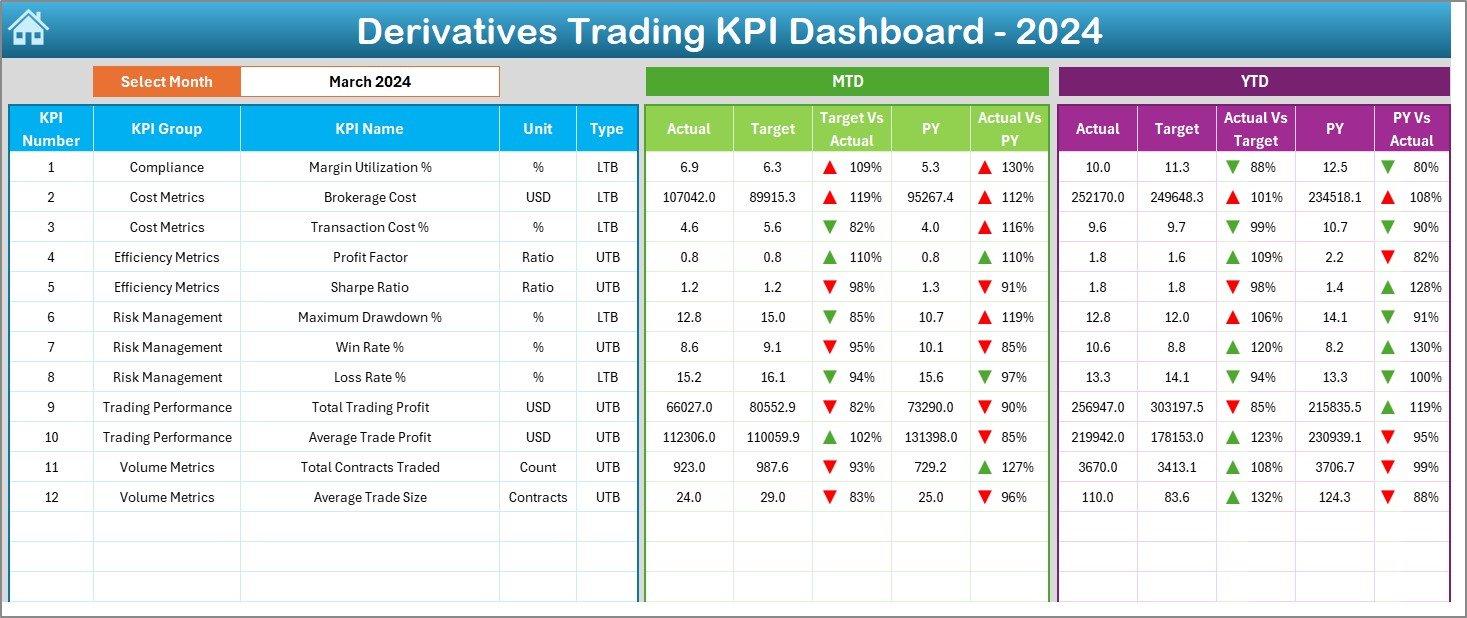
📊 Dashboard Sheet
The main performance cockpit. Users select the month from a dropdown, and the entire dashboard updates automatically. It displays MTD and YTD Actuals, Targets, Previous Year values, and performance ratios, supported by conditional formatting arrows for quick interpretation.
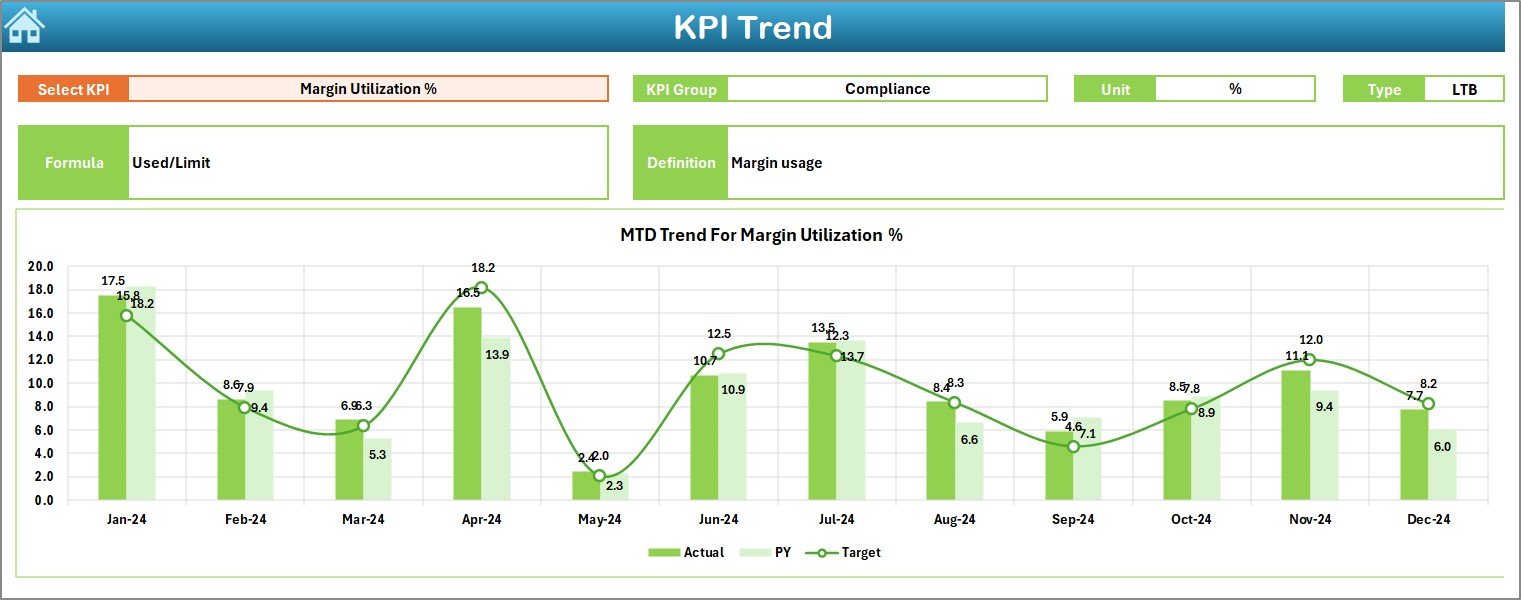
📈 KPI Trend Sheet
Focused on trend analysis. Users select a KPI, and Excel displays MTD and YTD trend charts comparing Actual, Target, and Previous Year values, helping traders detect consistency, volatility, and strategy impact.
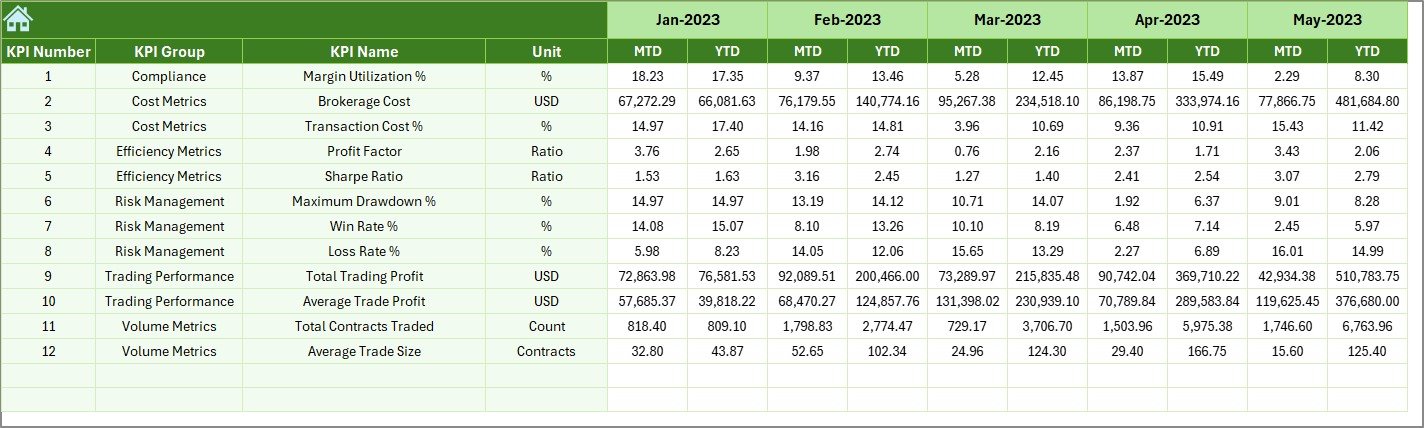
🧾 Actual Numbers Input Sheet
Stores real trading performance values for each KPI with structured month logic to ensure clean calculations.
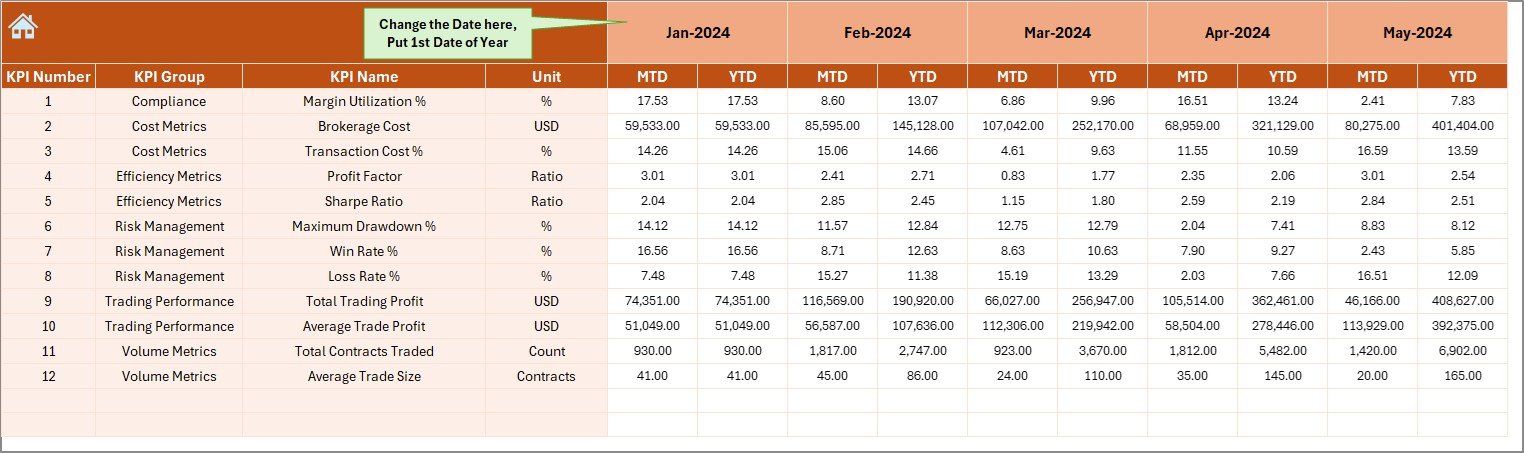
🎯 Target Sheet
Maintains MTD and YTD target benchmarks separately, ensuring objective performance comparison.
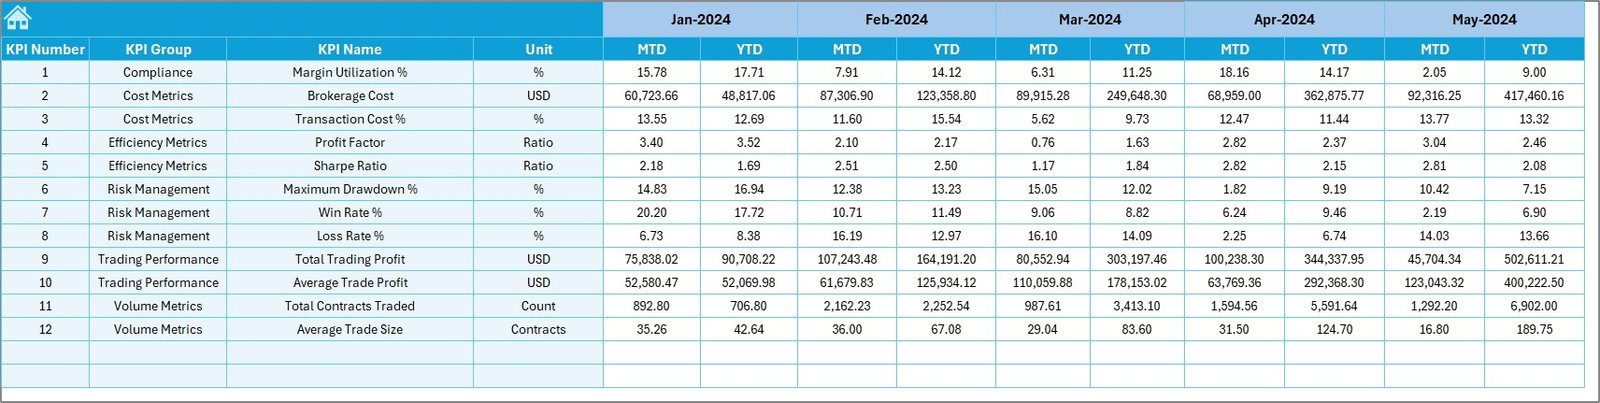
📉 Previous Year Number Sheet
Allows year-over-year benchmarking by storing last year’s trading data in the same format.
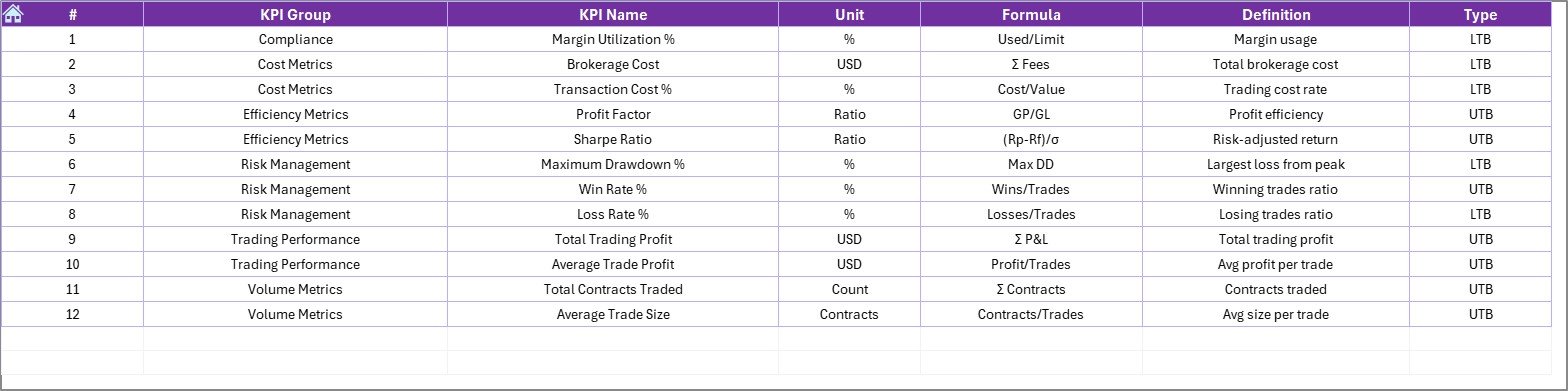
📘 KPI Definition Sheet
Defines KPI name, group, unit, formula, and meaning, ensuring transparency and standard interpretation across trading teams.
🛠️ How to Use the Derivatives Trading KPI Dashboard
✅ Step 1: Enter actual trading performance in the Actual Numbers Input Sheet
✅ Step 2: Define trading goals in the Target Sheet
✅ Step 3: Load previous year data for benchmarking
✅ Step 4: Select a month from the dashboard dropdown
✅ Step 5: Review KPIs, indicators, and trend charts instantly
No advanced Excel skills required. The dashboard is plug-and-trade ready.
👥 Who Can Benefit from This Dashboard?
📉 Derivatives Traders
📊 Trading Desk Managers
⚠️ Risk Management Teams
📈 Investment & Portfolio Analysts
💼 Finance & Strategy Leaders
🏦 Proprietary & Institutional Trading Desks
Any team tracking futures, options, swaps, or structured derivatives will see immediate value.
🔗 Click here to read the Detailed blog post
🎥 Visit our YouTube channel to learn step-by-step video tutorials


Reviews
There are no reviews yet.