In an era where digital threats evolve faster than ever, every organization needs a way to monitor, analyze, and respond to cybersecurity incidents with precision. The Cybersecurity Dashboard in Excel is a ready-to-use, data-driven template designed to help IT and security teams track cyber incidents, assess risk levels, and improve response times — all within the simplicity and flexibility of Microsoft Excel.
Built for both small businesses and large enterprises, this Excel dashboard turns raw security data into clear, visual insights that highlight vulnerabilities, high-risk areas, and financial impacts — helping decision-makers stay ahead of potential threats.
With its automated charts, slicers, and performance cards, this template makes cybersecurity management simple, visual, and impactful.
⚙️ Key Features of the Cybersecurity Dashboard in Excel
🧾 Five Analytical Pages for Complete Security Insights
This dashboard includes Overview, Department Analysis, Region Analysis, Category Analysis, and Monthly Trends pages — each crafted for specific layers of cybersecurity monitoring.
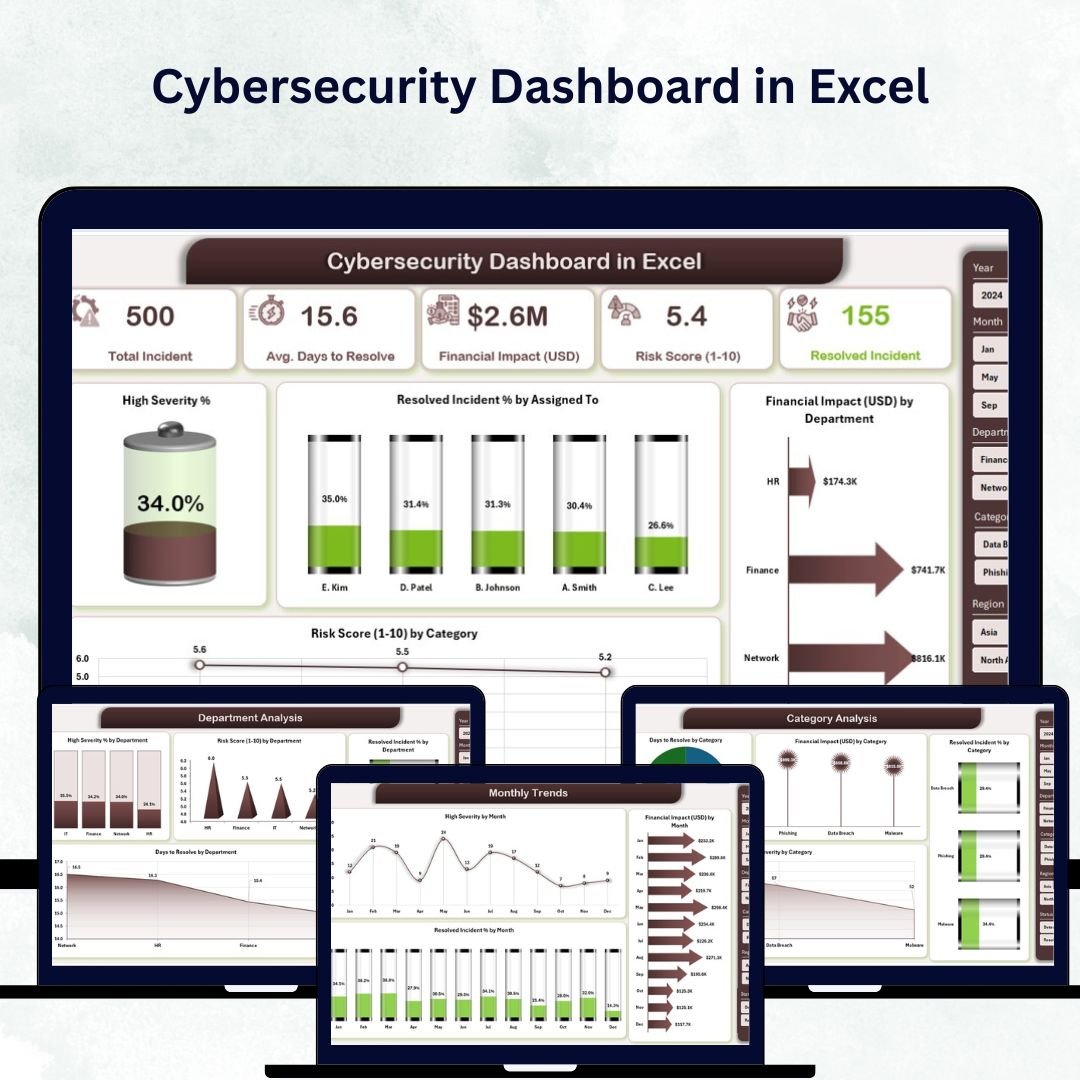
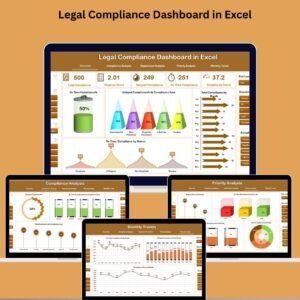
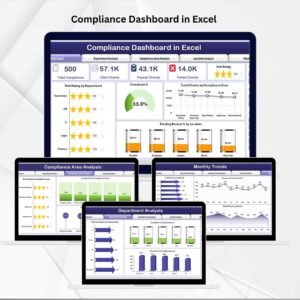
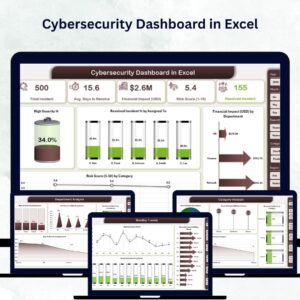
📊 Overview Page – The Command Center
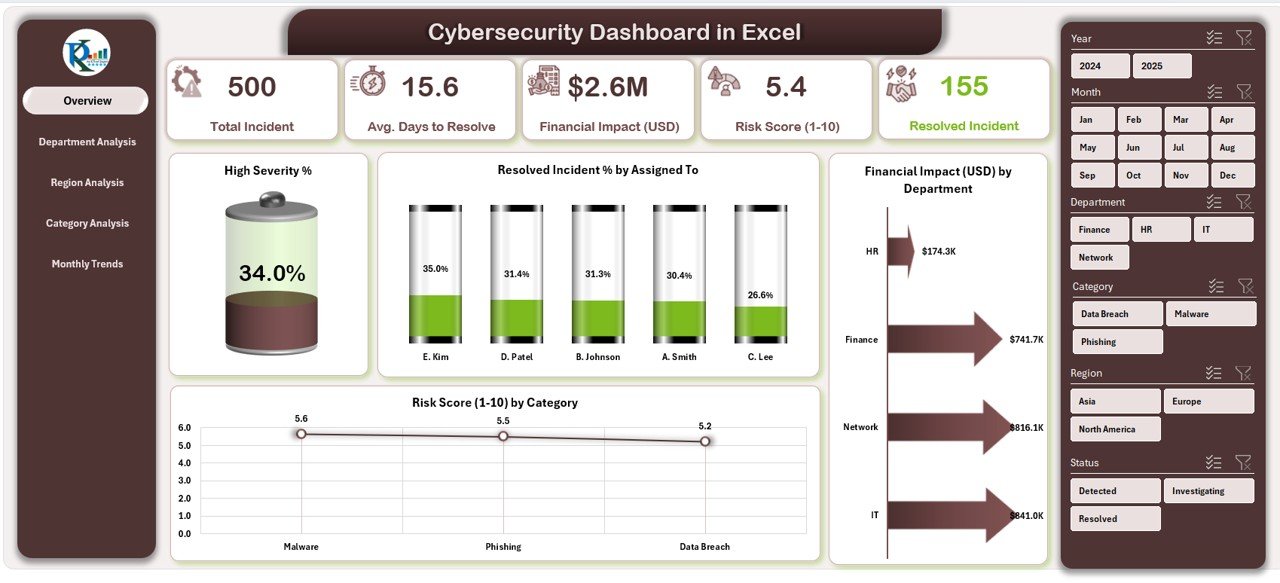
The Overview Page summarizes your organization’s cybersecurity performance through:
-
5 KPI Cards: Total Incidents, Resolved %, Financial Losses, Average Resolution Time, Risk Score.
-
Interactive Slicers: Filter by department, category, or time period.
-
Visual Charts:
-
High Severity %
-
Resolved Incident % by Assigned To
-
Financial Impact (USD) by Department
-
Risk Score (1–10) by Category
-
This centralized view gives management an instant understanding of where risks lie and how quickly incidents are being resolved.
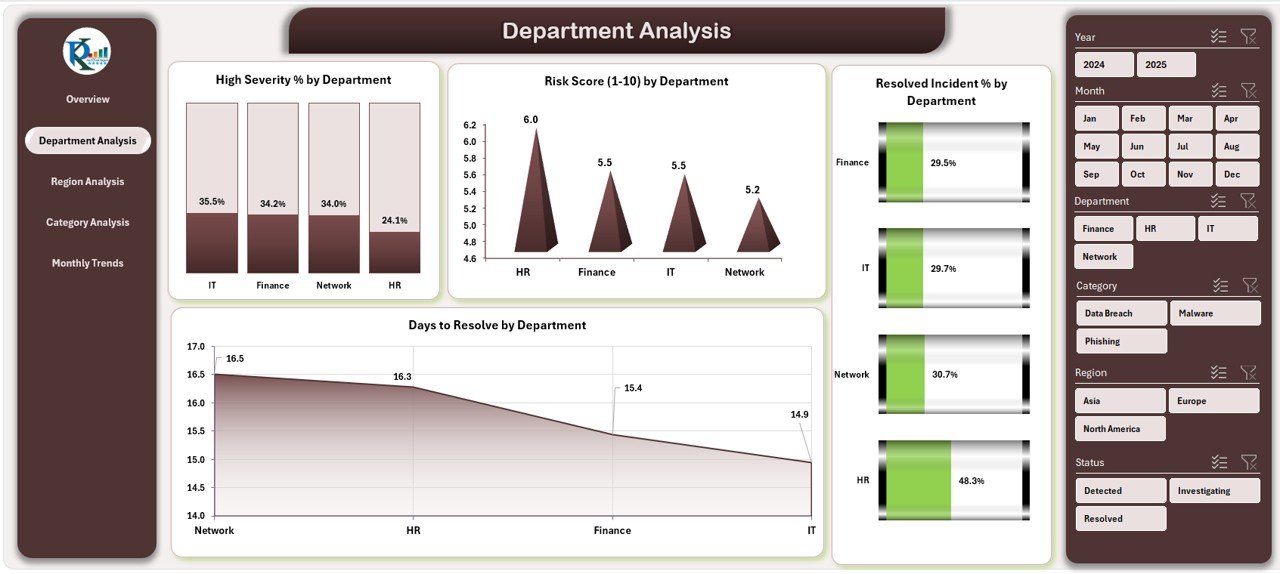
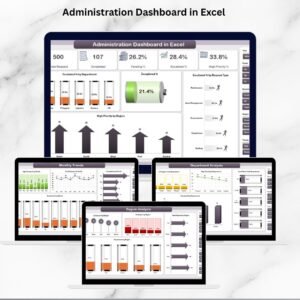
🏢 Department Analysis – Track Security by Team
Identify which departments face the most security challenges or delays in response.
Includes charts for:
-
High Severity % by Department
-
Risk Score (1–10) by Department
-
Resolved Incident % by Department
-
Days to Resolve by Department
Right-side slicers let you filter by department or timeline for deeper analysis.
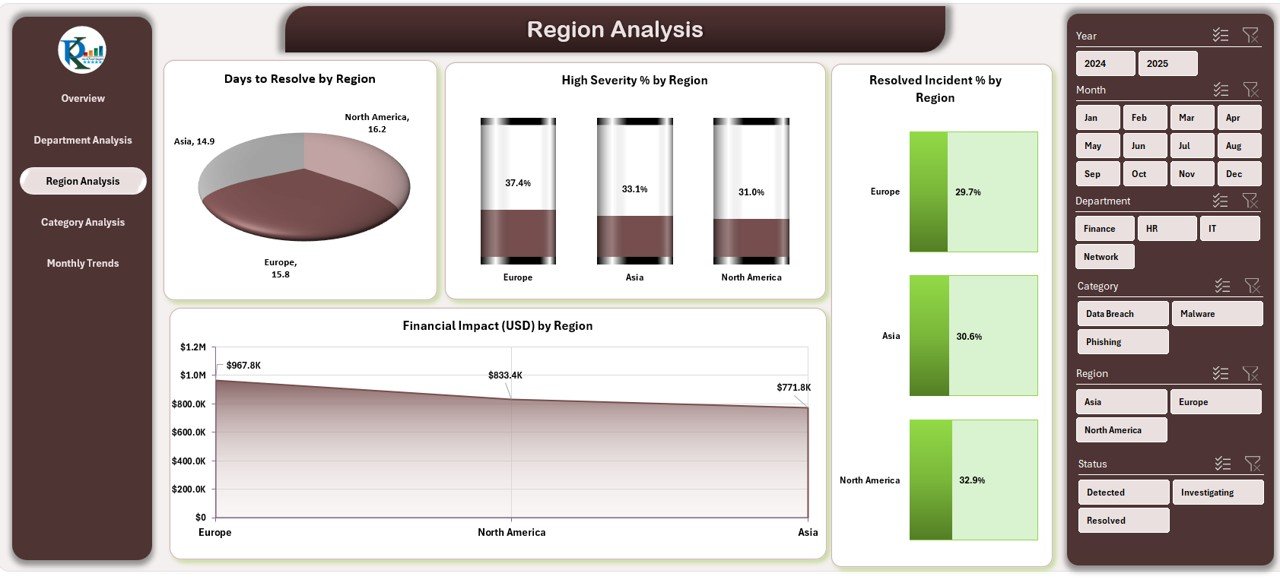
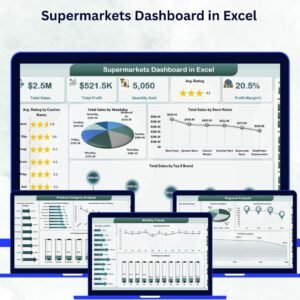
🌍 Region Analysis – Geographical Risk Mapping
Visualize how cyber threats differ by location.
Charts include:
-
Days to Resolve by Region
-
High Severity % by Region
-
Resolved Incident % by Region
-
Financial Impact (USD) by Region
Perfect for global organizations managing multi-regional cybersecurity operations.
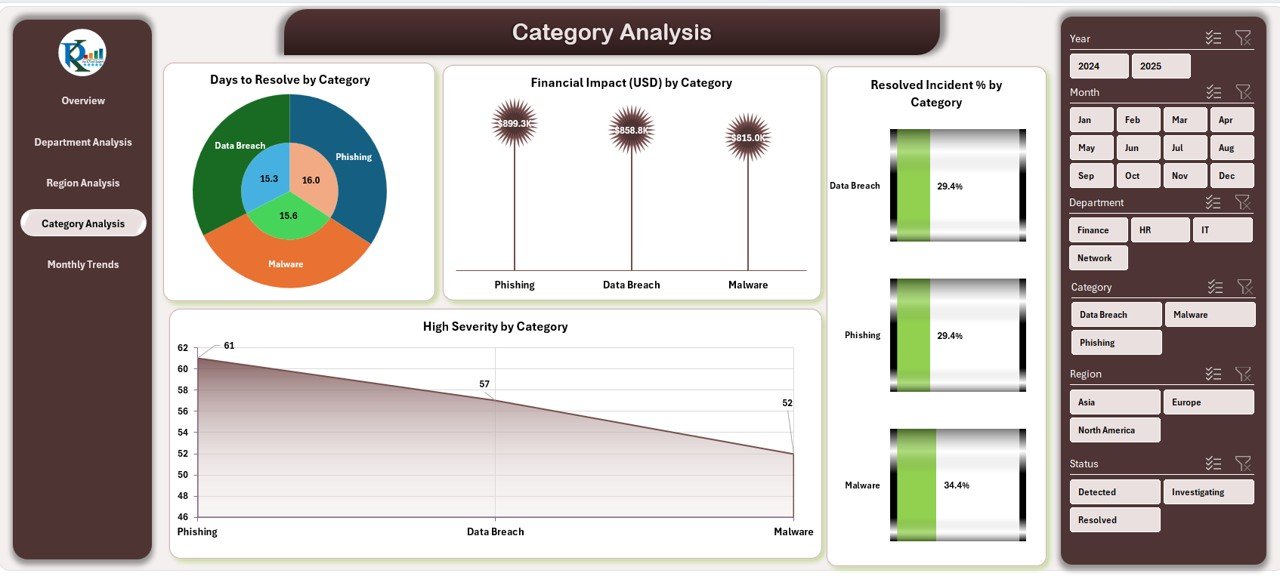
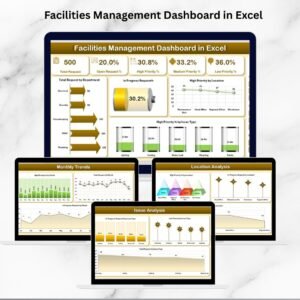
🧩 Category Analysis – Understand Threat Types
Get visibility into recurring cyber threats such as phishing, ransomware, or insider breaches.
Charts include:
-
Days to Resolve by Category
-
High Severity % by Category
-
Resolved Incident % by Category
-
Financial Impact (USD) by Category
Helps security teams prioritize prevention strategies where they matter most.
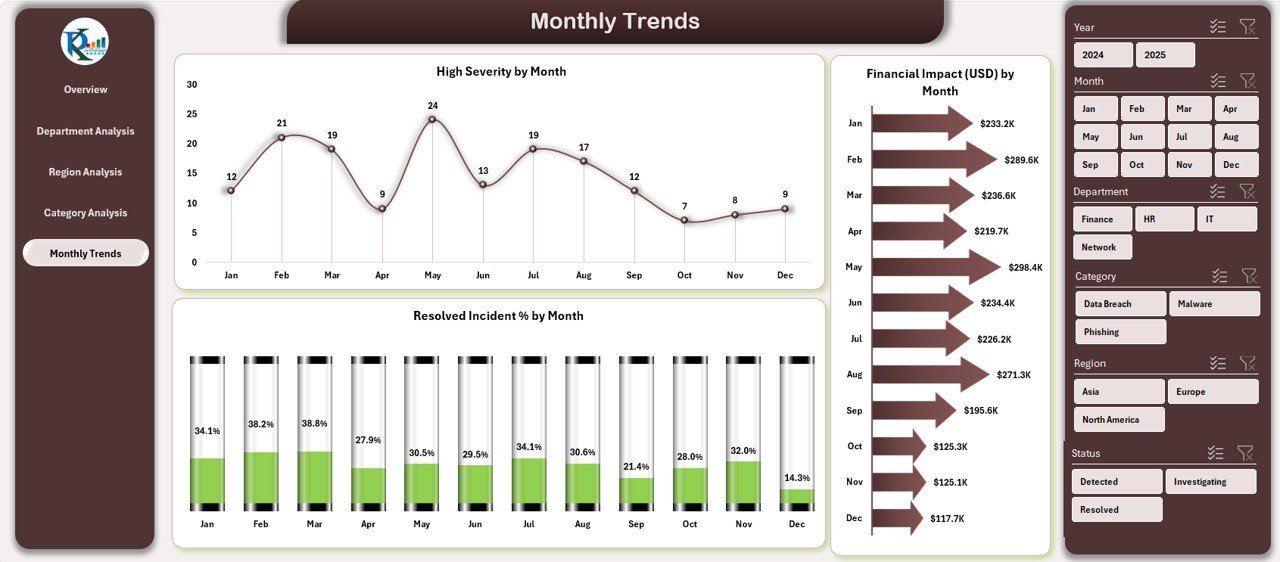
📅 Monthly Trends – Track Performance Over Time
Monitor cybersecurity health month by month.
Charts include:
-
High Severity % by Month
-
Resolved Incident % by Month
-
Financial Impact (USD) by Month
Identify improvements, detect anomalies, and evaluate overall progress over time.
📊 What’s Inside the Cybersecurity Dashboard Template
1️⃣ Overview Page: Summary of incidents, costs, and severity.
2️⃣ Department Analysis Page: Department-wise performance tracking.
3️⃣ Region Analysis Page: Regional risk comparison.
4️⃣ Category Analysis Page: Incident type insights.
5️⃣ Monthly Trends Page: Time-based trend visualization.
6️⃣ Data Sheet & Support Sheet: Raw data and dropdown references for seamless automation.
🧭 How to Use the Cybersecurity Dashboard in Excel
✅ Step 1: Enter incident data in the Data Sheet — include incident date, category, department, region, severity, and cost.
✅ Step 2: Refresh PivotTables to update visuals automatically.
✅ Step 3: Use slicers to filter by department, category, or time.
✅ Step 4: Review KPIs and trend charts to identify security hotspots.
✅ Step 5: Share or present your findings to management.
Within minutes, you’ll have a complete cybersecurity monitoring system — no coding, macros, or complex software required.
👥 Who Can Benefit from This Dashboard
💻 IT Security Managers: Track real-time threat patterns and resolution times.
🏢 CIOs & Executives: Monitor organizational cybersecurity posture at a glance.
🔐 Department Heads: Identify internal risk zones and improve security compliance.
📊 Consultants & Auditors: Present client security assessments in visual format.
🚀 SMEs: Gain cybersecurity visibility without expensive BI tools.
🌟 Advantages of the Cybersecurity Dashboard in Excel
✅ Centralized Cyber Risk Monitoring: View all incidents and KPIs in one place.
✅ Real-Time Insights: Instantly detect high-severity threats and resolution delays.
✅ Cost Efficiency: No need for Power BI licenses or paid software.
✅ Customizable & Scalable: Modify KPIs, visuals, or layouts effortlessly.
✅ Improved Compliance: Track performance for audit and policy adherence.
✅ Time Savings: Automated analytics reduce manual reporting work.
✅ Data Control: Keep your cybersecurity data secure within your environment.
🔗 Click here to read the Detailed Blog Post
🎥 Visit our YouTube channel for step-by-step tutorials
🔗 YouTube.com/@PKAnExcelExpert


Reviews
There are no reviews yet.