


In today’s competitive marketplace, customer satisfaction isn’t just a metric—it’s the foundation of business growth and long-term success. Our Customer Satisfaction Dashboard in Power BI is a ready-to-use, interactive tool that empowers organizations to measure, track, and optimize their customer service performance in real time. From analyzing tickets and response times to monitoring SLA compliance and overall satisfaction scores, this dashboard helps businesses make data-driven decisions that improve customer experience and drive retention.
⭐ Key Features of Customer Satisfaction Dashboard in Power BI
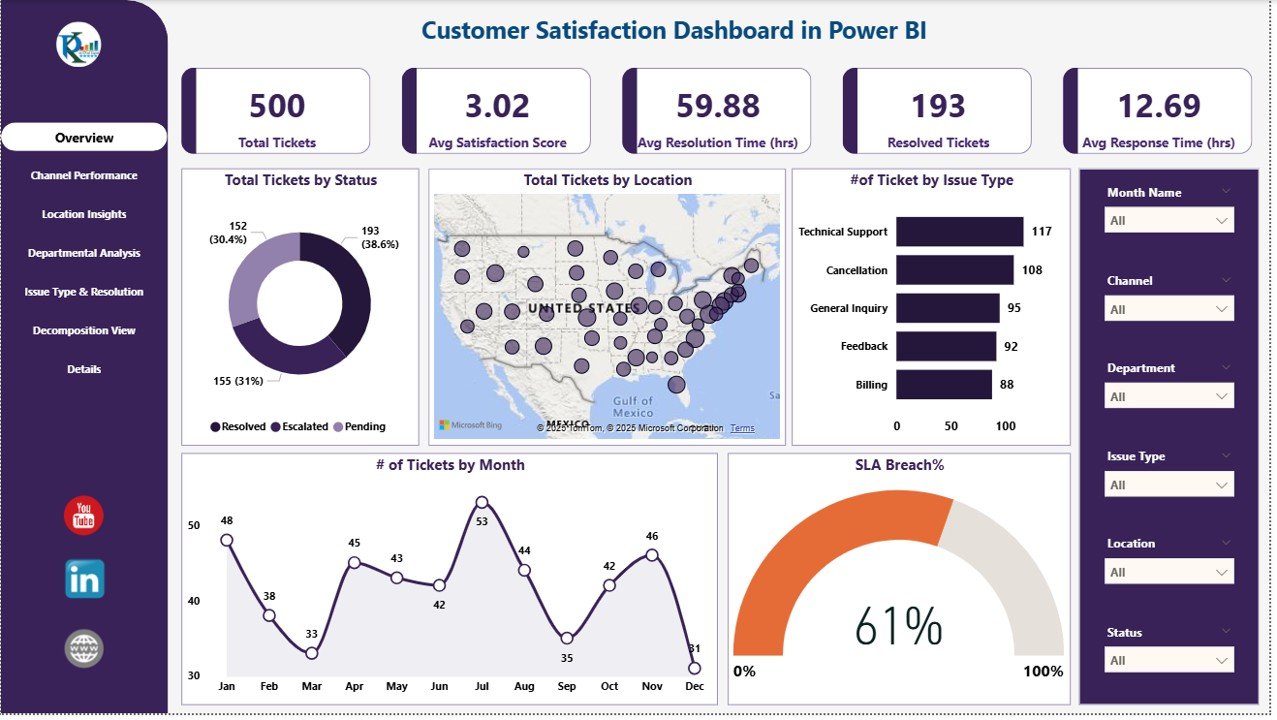
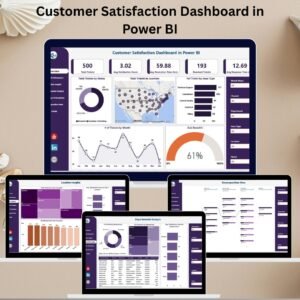
1. Comprehensive Overview Page 📊
The Overview Page gives managers and analysts a high-level snapshot of customer support operations. You can instantly see:
-
Total Tickets logged by customers
-
Average Satisfaction Score to gauge service quality
-
Average Resolution & Response Time to measure efficiency
-
Resolved Tickets Count for tracking successful outcomes
Dynamic charts visualize:
-
Ticket status (open, closed, pending)
-
Ticket distribution by location or issue type
-
SLA breach percentages
-
Monthly trends in ticket volume
This makes it easy to spot issues and take corrective actions quickly.
2. Channel Performance Insights 📞💬
Track how your support team performs across different communication channels such as phone, chat, and email. You’ll be able to compare:
-
Number of tickets per channel
-
Average response and resolution times
-
Satisfaction scores by channel
-
SLA breaches by channel
This helps you identify which support channels deliver the best experiences and which need improvement.
3. Location & Departmental Analysis 🌍🏢
Gain visibility into performance at different locations and departments:
-
See which regions have the highest ticket volume and satisfaction scores
-
Track SLA breach rates by location or department
-
Monitor department efficiency and workload distribution
With this, you can identify top-performing regions or departments and focus on areas that need attention.
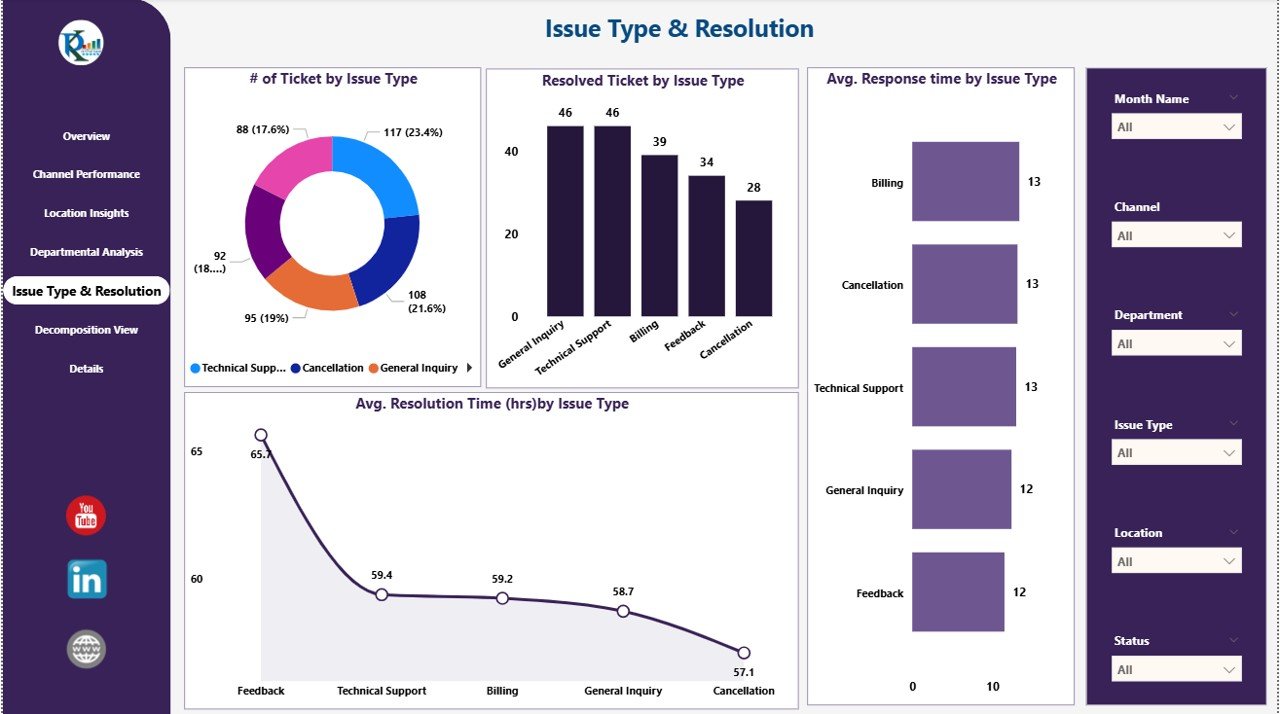
4. Issue Type & Resolution Tracking ⚡
Not all customer issues are the same. This dashboard allows you to:
-
Track ticket types (technical, billing, product, etc.)
-
Analyze how quickly different issue types are resolved
-
Identify recurring problems that impact customer satisfaction
By understanding the nature of customer issues, you can allocate resources effectively and reduce resolution delays.
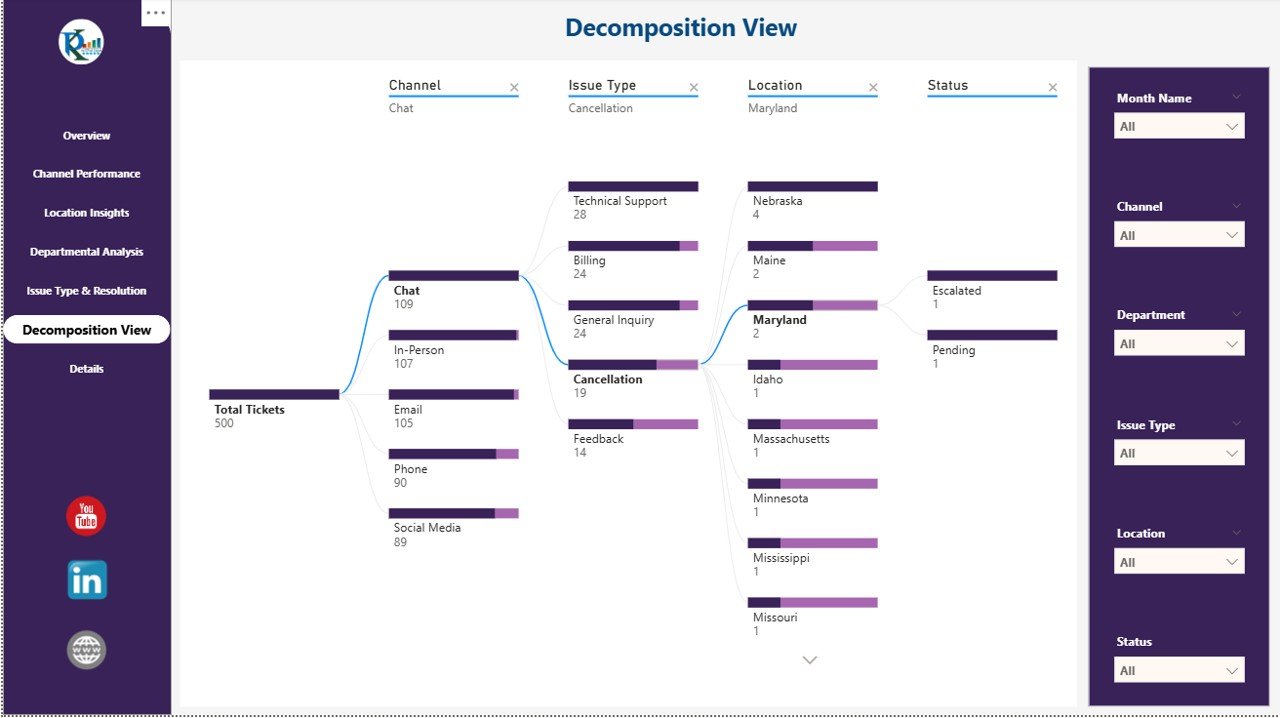
5. Decomposition & Drill-Down View 🔍
For advanced analysis, the Decomposition Tree helps you explore ticket data across multiple dimensions—such as issue type, channel, or SLA compliance. This feature enables you to dig deeper into problem areas and uncover root causes with just a few clicks.
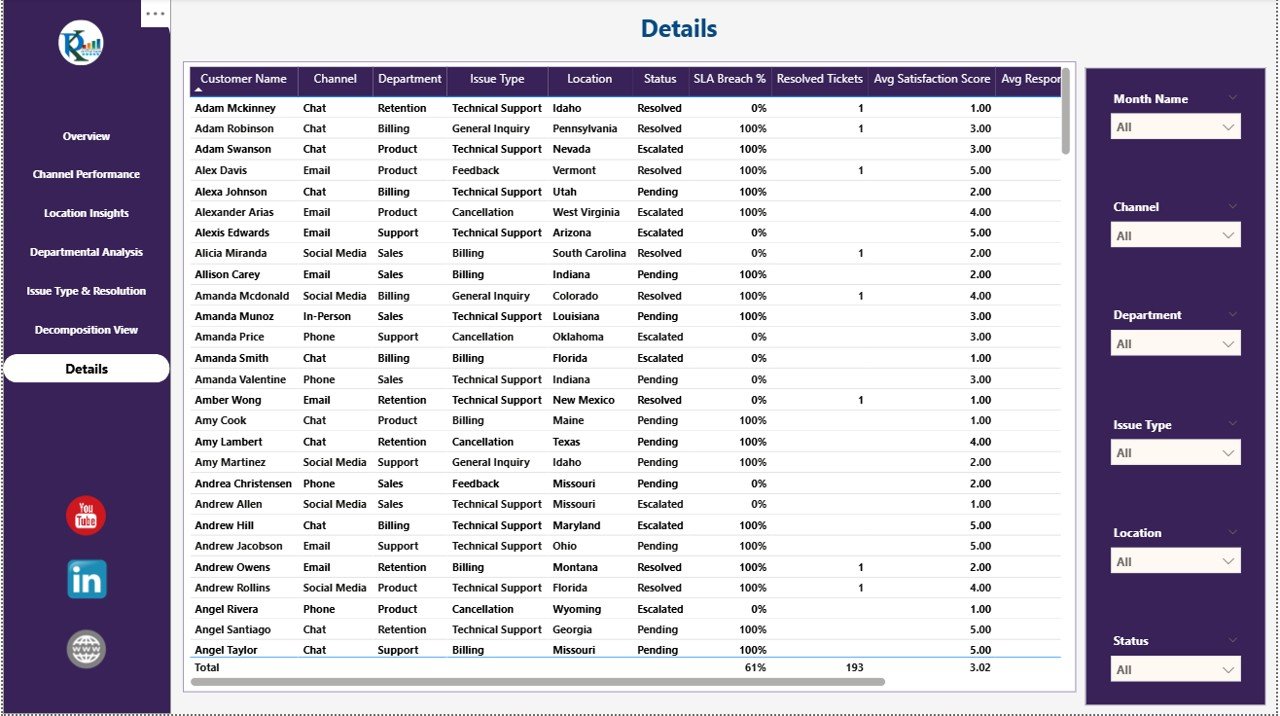
6. Detailed Ticket Reports 📑
The Details Page provides a table-based view of every ticket logged. With this granular data, managers can audit performance, track escalations, and generate reports for stakeholders with ease.
💡 Who Can Benefit from This Dashboard?
-
Customer Service Managers → Track KPIs and team performance
-
Business Analysts → Identify patterns and optimize workflows
-
Team Leaders → Monitor workload distribution across teams
-
Executives → Get high-level performance summaries for strategic decisions
✅ How to Use the Dashboard
-
Load your customer service ticket data into Power BI.
-
Use interactive filters to analyze by time period, department, issue type, or channel.
-
Monitor KPIs daily, weekly, or monthly.
-
Identify problem areas such as high SLA breach rates or low satisfaction scores.
-
Take data-driven actions to improve customer service quality.
🌟 Benefits of Using the Customer Satisfaction Dashboard
-
Real-Time Tracking → Stay updated with live performance metrics
-
SLA Compliance Monitoring → Spot and address SLA breaches immediately
-
Enhanced Decision-Making → Use data to refine customer service strategies
-
Efficiency Boost → Reduce response and resolution times
-
Customer Loyalty → Improve customer experiences to retain clients
📌 Click here to read the Detailed Blog Post
Watch the step-by-step video Demo:


Reviews
There are no reviews yet.