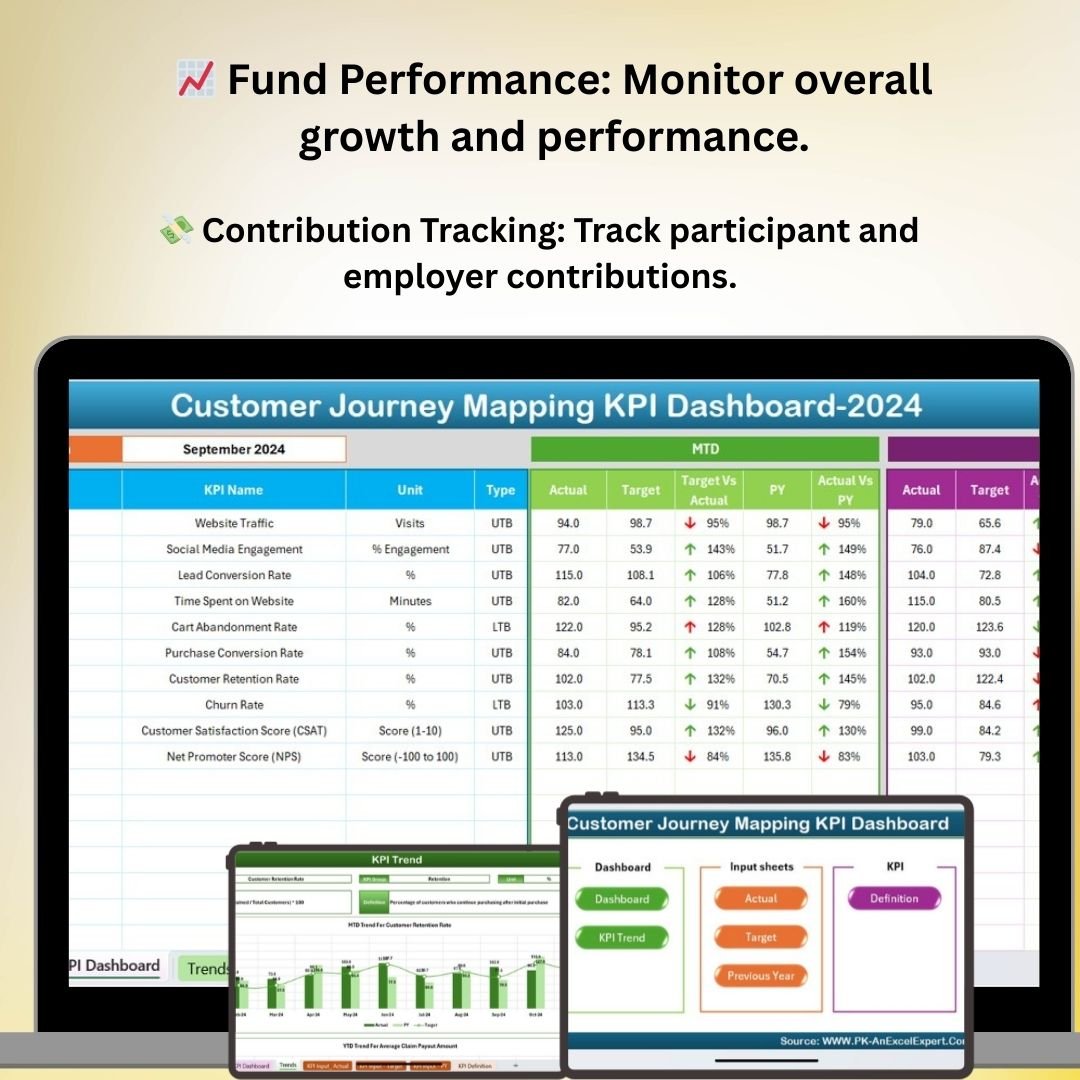
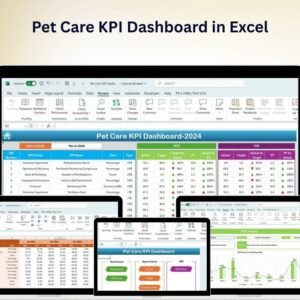
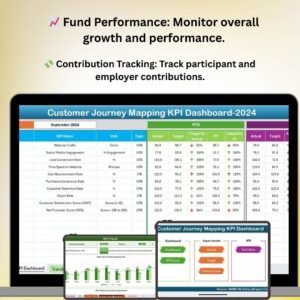
The Customer Journey Mapping KPI Dashboard in Excel is an essential tool for businesses and marketing teams aiming to visualize and optimize the customer experience. This comprehensive Excel dashboard allows you to track and analyze key performance indicators (KPIs) throughout the customer journey, from awareness to conversion and beyond.
This tool helps you understand how customers interact with your brand, identify pain points, and discover opportunities to enhance customer satisfaction. With easy-to-use tracking features and customizable KPIs, the dashboard is perfect for marketing teams, customer experience managers, and business owners seeking data-driven insights into their customer journey.
Key Features of the Customer Journey Mapping KPI Dashboard in Excel
📊 Comprehensive Journey Mapping
Track the entire customer journey, from the first touchpoint to post-purchase. Understand how customers move through each phase, including awareness, consideration, purchase, and retention.
📈 Key KPI Tracking
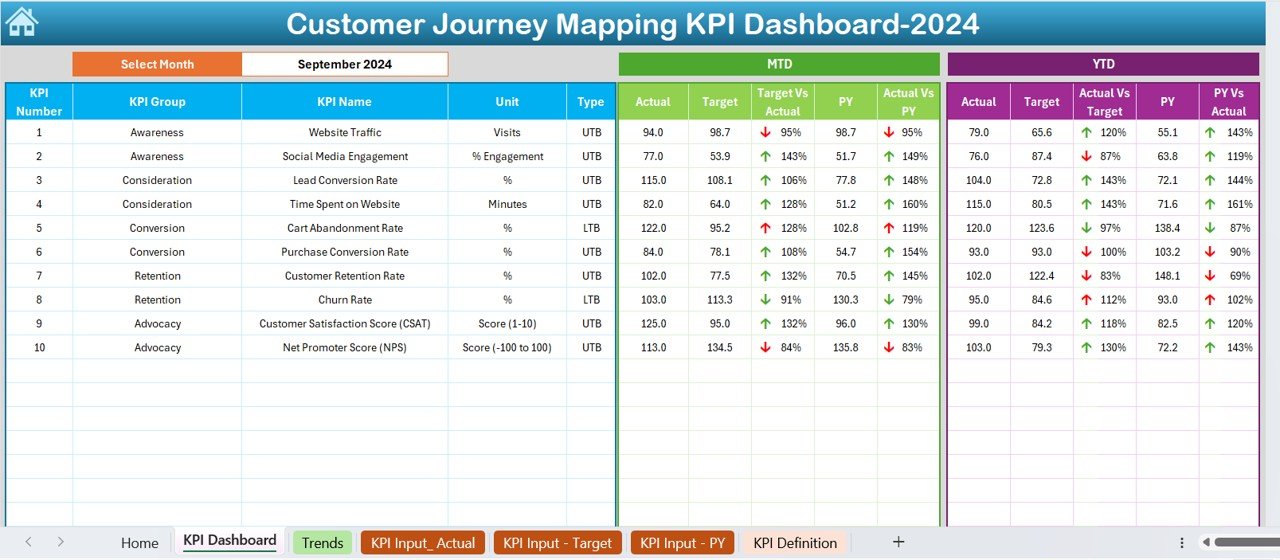
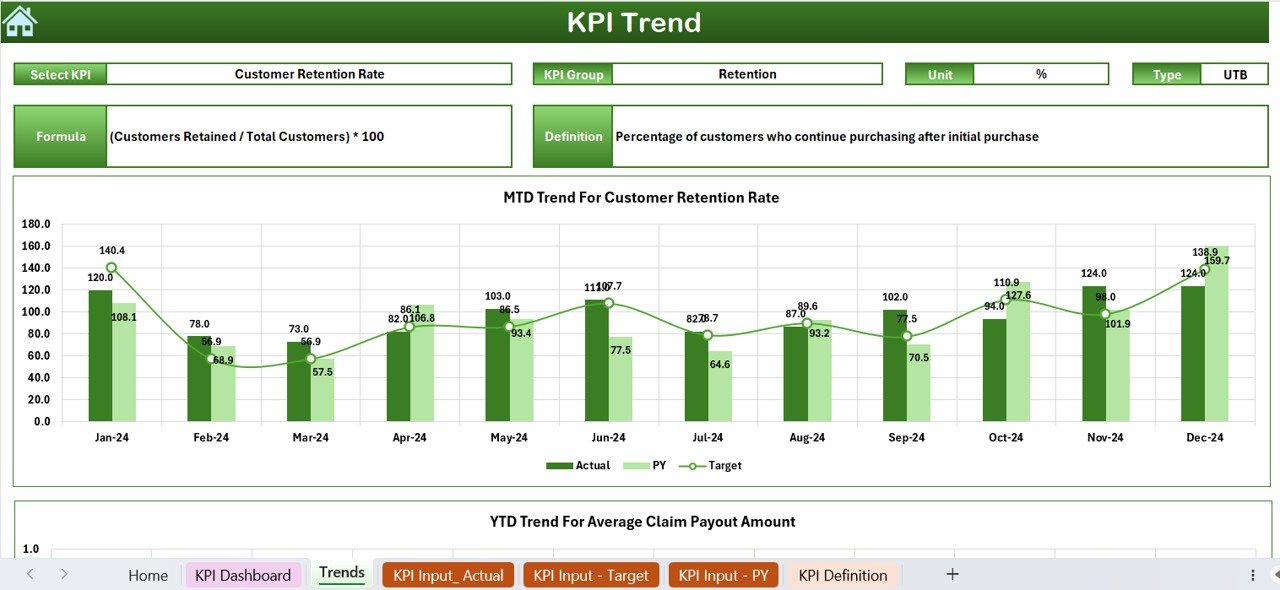
Monitor important KPIs such as customer satisfaction, conversion rates, website traffic, and engagement metrics. Track how each KPI evolves as customers progress through different stages of their journey.
📉 Conversion Funnel Analysis
Analyze the conversion funnel to understand where potential customers are dropping off and identify areas for improvement in your sales and marketing processes.
🔄 Customer Segmentation Insights
Segment customers by behavior, demographics, or purchasing patterns to analyze how different segments navigate their journey. This helps you tailor strategies for each customer group.
💡 Real-Time Data Integration
Integrate real-time data from various sources such as websites, CRM systems, and marketing platforms. Ensure that you’re working with the most up-to-date information for informed decision-making.
⚙️ Customizable Dashboards & KPIs
Customize the dashboard to track the KPIs that matter most to your business. Adjust metrics based on your specific business needs or customer journey stages.
Why You’ll Love the Customer Journey Mapping KPI Dashboard in Excel
✅ Visualize the Customer Journey
Get a clear and structured view of how customers interact with your brand. Visualize each phase of the journey to identify strengths and weaknesses in your marketing efforts.
✅ Improve Customer Experience
By tracking KPIs at each stage, you can understand customer behavior and make targeted improvements to enhance satisfaction and retention.
✅ Optimize Conversion Rates
Understand where customers drop off in the conversion funnel and implement strategies to improve engagement and boost conversion rates.
✅ Customer Segmentation
Gain valuable insights into different customer segments, allowing you to tailor your strategies and optimize the journey for each group.
✅ Customizable & Scalable
The dashboard is highly customizable to fit your business goals. Track the metrics that matter most, scale the dashboard for future growth, and make adjustments as your business evolves.
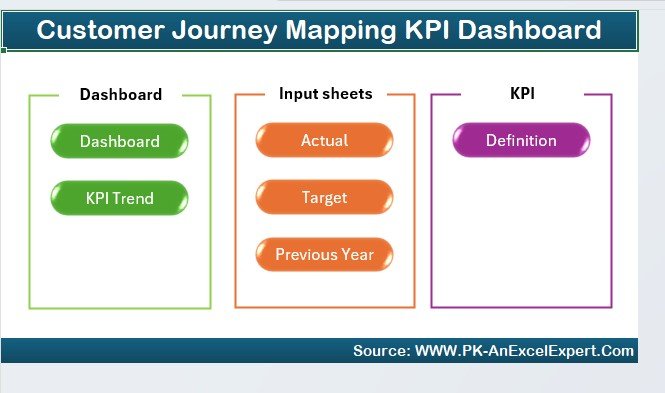
What’s Inside the Customer Journey Mapping KPI Dashboard in Excel?
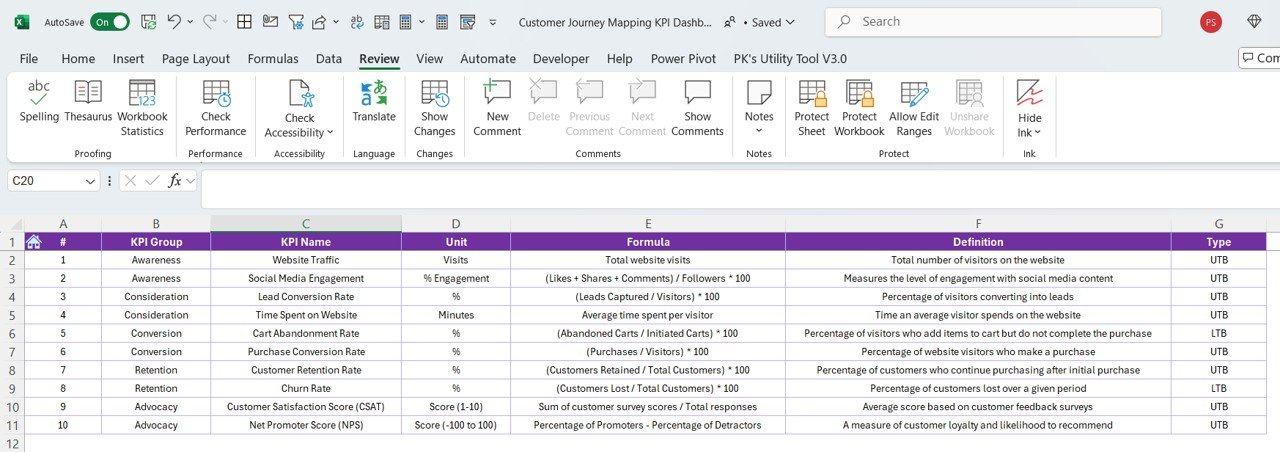
- Comprehensive Journey Mapping: Track customers from awareness to retention.
- KPI Tracking: Monitor customer satisfaction, conversion rates, traffic, and engagement.
- Conversion Funnel Analysis: Identify areas of drop-off and optimize the conversion process.
- Customer Segmentation: Segment customers by behavior and demographics for better targeting.
- Real-Time Data Integration: Link real-time data from your marketing and CRM systems.
- Customizable Dashboard: Adjust KPIs and metrics based on your business goals.
How to Use the Customer Journey Mapping KPI Dashboard in Excel
1️⃣ Download the Template: Get access to the Customer Journey Mapping KPI Dashboard in Excel instantly.
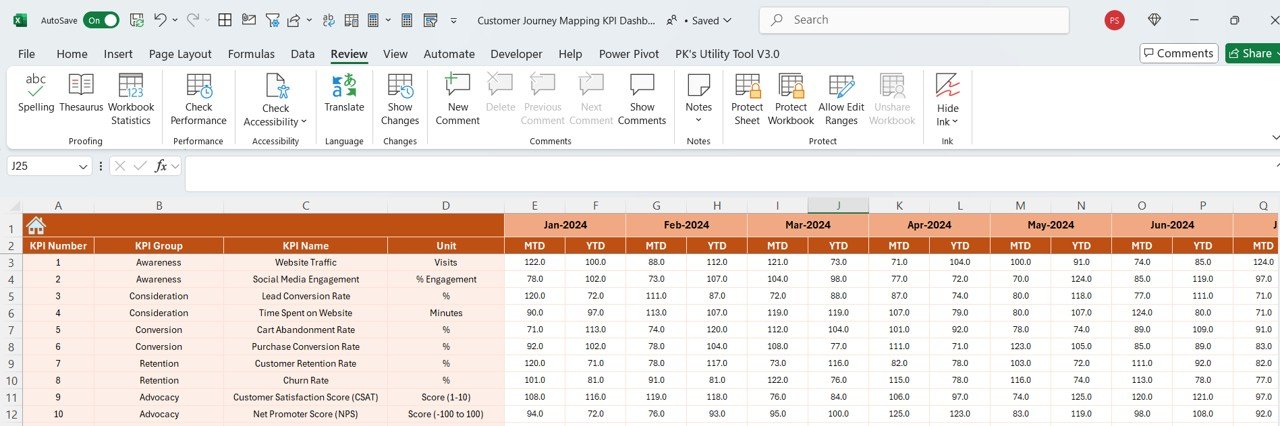
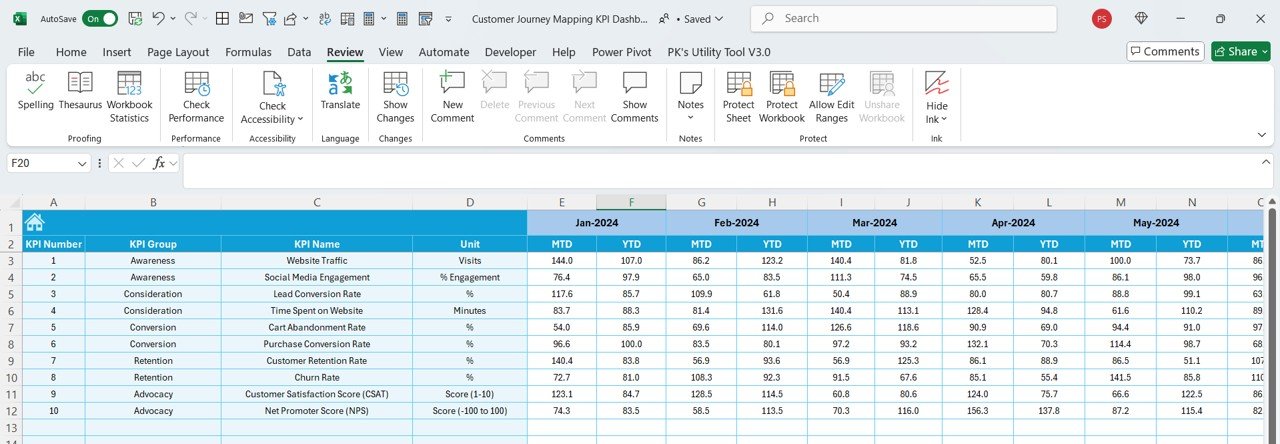
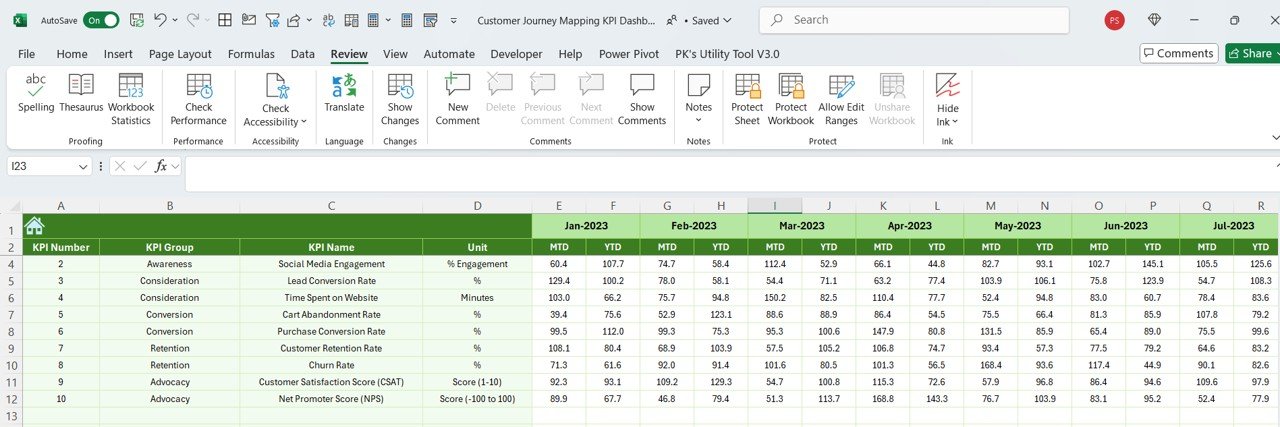
2️⃣ Input Data from Your Sources: Integrate data from your website, CRM system, and marketing platforms.
3️⃣ Track KPIs & Monitor Progress: Track key KPIs such as conversion rates, customer satisfaction, and website engagement.
4️⃣ Analyze Customer Segments: Use segmentation data to better understand customer behavior and tailor your strategies.
5️⃣ Make Data-Driven Decisions: Use insights from the dashboard to refine your customer journey strategy and enhance the customer experience.
Who Can Benefit from the Customer Journey Mapping KPI Dashboard in Excel?
🔹 Marketing Teams & Campaign Managers
🔹 Customer Experience Managers
🔹 E-commerce & Retail Businesses
🔹 Business Owners & Entrepreneurs
🔹 Data Analysts & Marketing Analysts
🔹 Customer Service & Retention Teams
🔹 CRM Managers & Sales Teams
Optimize your customer journey strategy with the Customer Journey Mapping KPI Dashboard in Excel. Track KPIs, visualize customer behavior, and improve the overall experience to increase customer satisfaction and retention.
Click here to read the Detailed blog post
Visit our YouTube channel to learn step-by-step video tutorials
Youtube.com/@PKAnExcelExpert


Reviews
There are no reviews yet.