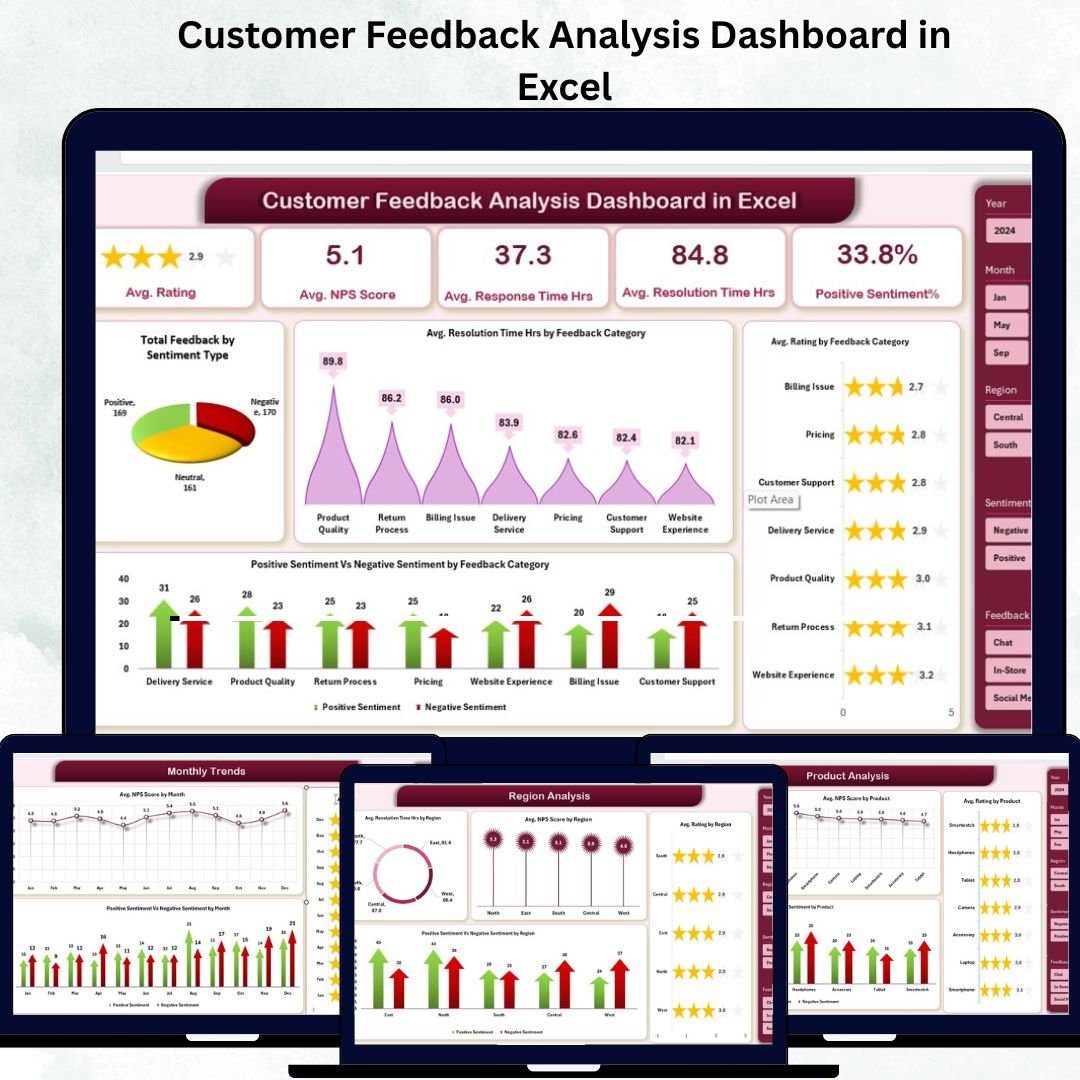
Customer Feedback Analysis Dashboard in Excel is your all-in-one solution for turning customer opinions into actionable insights 📊. Whether your feedback comes from surveys, emails, social media, or chat, this ready-to-use Excel dashboard helps you visualize satisfaction, track sentiment, and measure performance — all without complex software or coding.
✨ Key Features of the Customer Feedback Analysis Dashboard in Excel
⭐ Comprehensive Feedback Visualization:
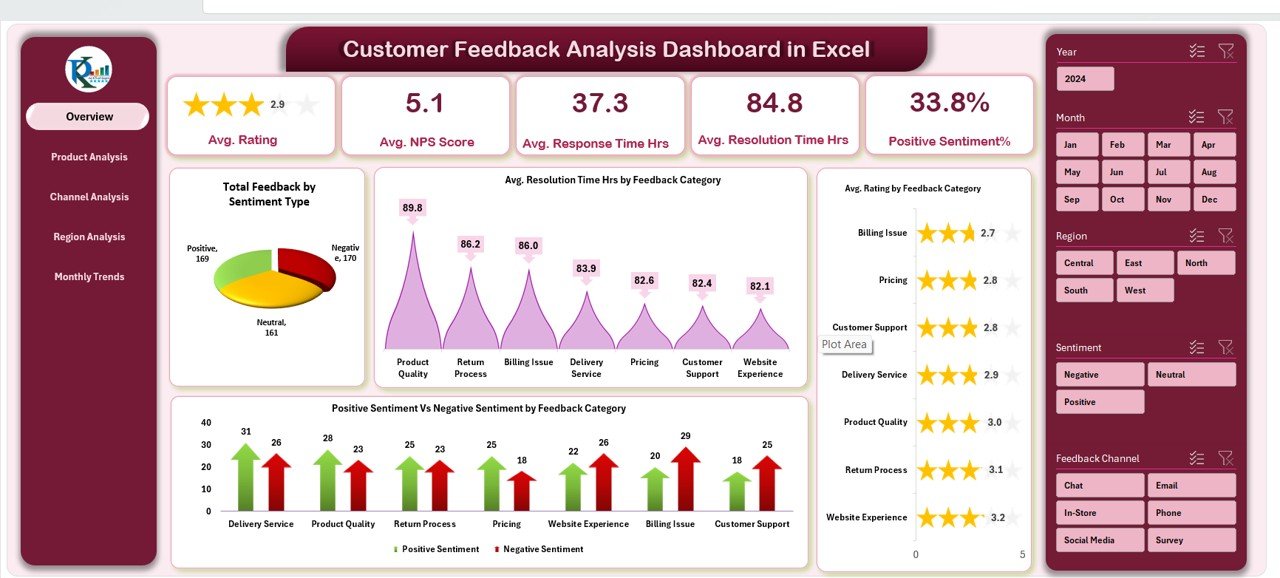
View all customer feedback data in one dynamic dashboard. Interactive KPI cards display Average Rating, NPS Score, Response Time, Resolution Time, and Positive Sentiment %.
📈 Multi-Level Analysis Tabs:
Analyze feedback across multiple perspectives — Overview, Product, Channel, Region, and Monthly Trends. Each tab includes ready-made pivot charts and insights for easy interpretation.
📊 Automated KPIs and Charts:
No manual work required! Once you paste your data, Excel automatically updates charts and KPI cards in real time.
🔍 Sentiment Breakdown:
Get a clear comparison between Positive, Neutral, and Negative responses by category, region, or product.
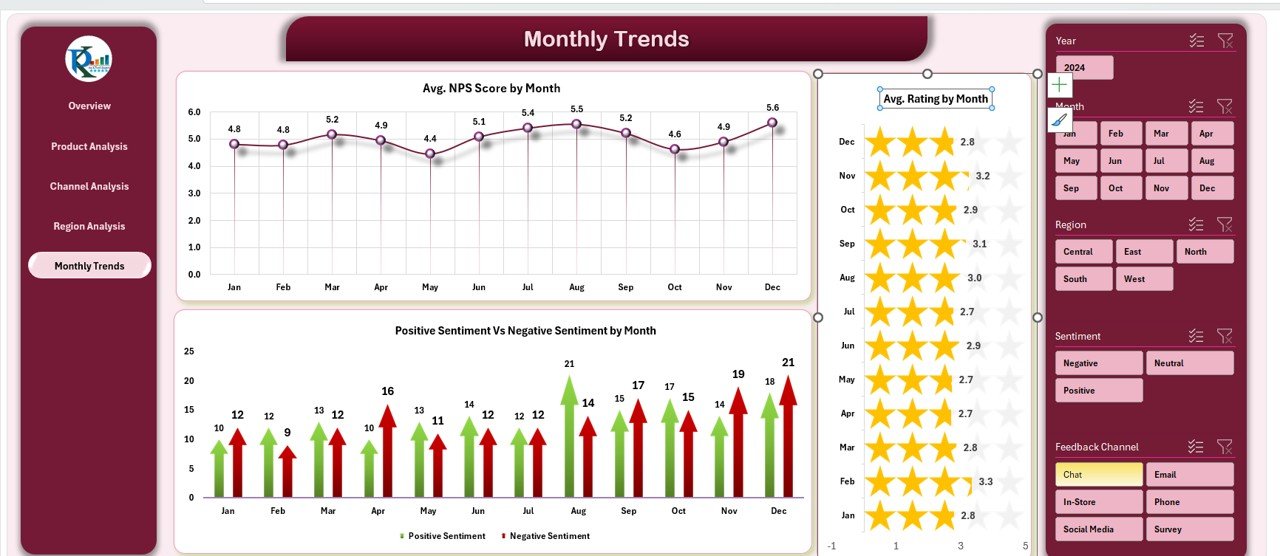
🕓 Performance Tracking Over Time:
Monthly trends help identify improvement areas and measure how changes affect customer satisfaction.
🧭 Interactive Slicers and Filters:
Filter results by product, channel, or region — perfect for drilling down into specific feedback sources.
⚙️ 100% Customizable:
Add or modify KPIs, adjust formulas, or redesign visuals — the flexibility of Excel means you stay in control.
💡 User-Friendly Interface:
No technical expertise needed. Anyone familiar with Excel can operate the dashboard easily.
📦 What’s Inside the Customer Feedback Analysis Dashboard in Excel
This pre-built Excel file includes multiple intelligently designed sheets:
1️⃣ Overview Sheet:
Shows top-level metrics through KPI cards and charts like Total Feedback by Sentiment Type, Average Resolution Time by Category, and Positive vs. Negative Sentiment by Category.
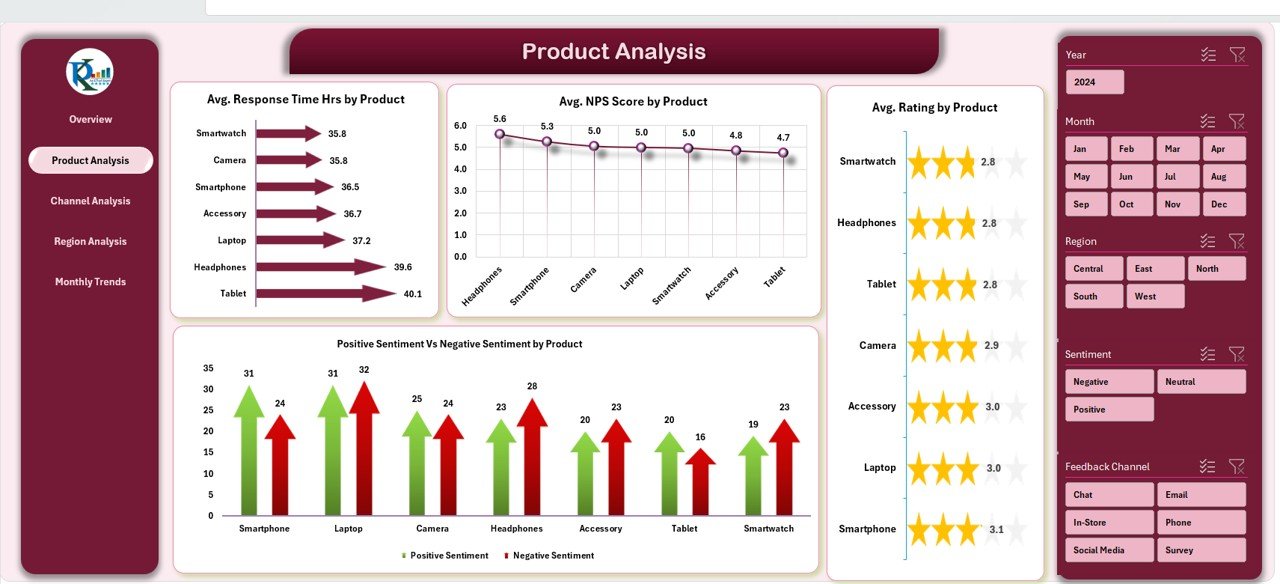
2️⃣ Product Analysis Sheet:
Compare performance across products with charts for Average Response Time, NPS Score, and Sentiment Distribution.
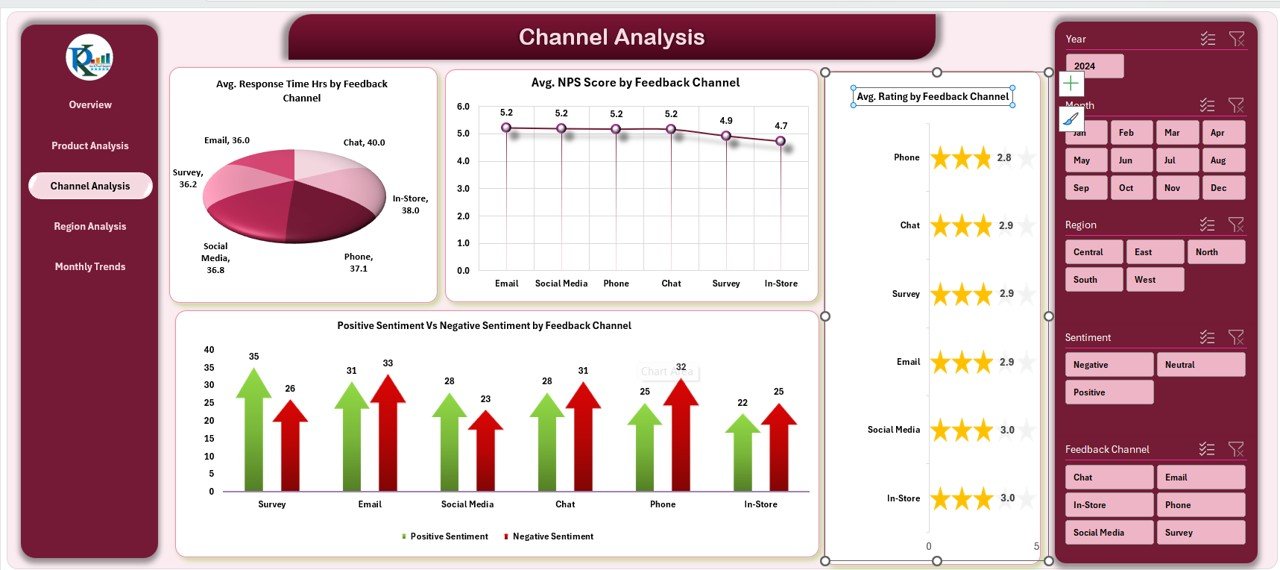
3️⃣ Channel Analysis Sheet:
Discover which communication channels perform best — see satisfaction and response time by email, chat, call, or social media.
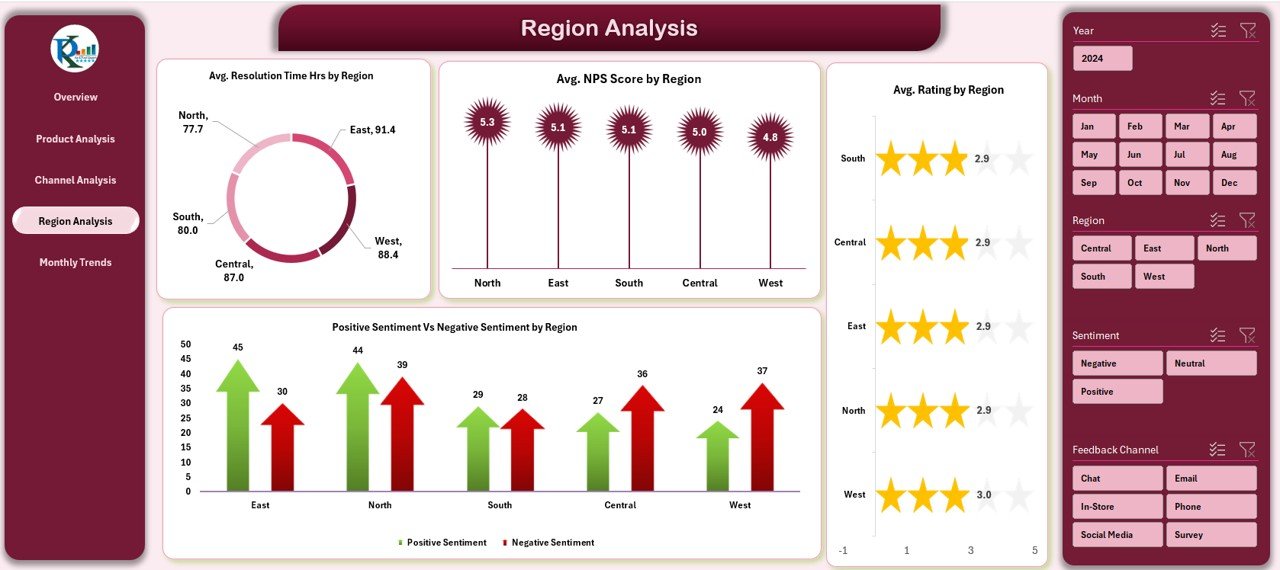
4️⃣ Region Analysis Sheet:
Understand customer sentiment by geography — spot regions with high satisfaction or delayed responses.
5️⃣ Monthly Trends Sheet:
Track how satisfaction, NPS, and sentiment evolve month-to-month.
6️⃣ Data Input Sheet:
Easily paste your raw feedback data — the entire dashboard updates automatically via pivot tables.
⚙️ How to Use the Customer Feedback Analysis Dashboard in Excel
1️⃣ Collect and Paste Data:
Gather feedback from forms, CRMs, or surveys and paste it into the Data Input Sheet.
2️⃣ Refresh Dashboard:
Click “Refresh All” — Excel automatically recalculates all KPIs and updates charts.
3️⃣ Analyze with Filters:
Use slicers to focus on specific months, regions, or products.
4️⃣ Draw Insights & Take Action:
Quickly identify slow response areas, low satisfaction products, or strong-performing regions.
This simple 4-step workflow helps you transform feedback into strategy effortlessly.
👥 Who Can Benefit from This Customer Feedback Analysis Dashboard in Excel
✅ Business Owners: Understand what customers love (or don’t) and make service improvements fast.
✅ Marketing Teams: Track campaign feedback, sentiment trends, and customer loyalty metrics.
✅ Customer Support Managers: Identify delays and optimize response or resolution times.
✅ Product Managers: Monitor product-specific feedback for targeted quality enhancements.
✅ Corporate Executives: Get a top-down performance view to guide data-driven decisions.
✅ Consultants & Analysts: Impress clients with visual reports and actionable insights.


Reviews
There are no reviews yet.