

🔑 Key Features of Crypto Portfolio Dashboard in Google Sheets
Crypto Portfolio Dashboard in Google Sheets is a professionally designed, cloud-based cryptocurrency analytics template that empowers crypto investors, traders, and portfolio managers to track Total Investment, Current Value, Total P&L, Total Transactions, and Avg Investment from a single interactive Google Sheets dashboard. This template includes 4 interactive dashboard pages, a dedicated Search sheet, a Data sheet, 5 high-level KPI cards, and multiple charts covering every dimension of crypto portfolio management — all powered by Google Sheets formulas with zero coding required.
Whether you hold Bitcoin, Ethereum, Solana, or a diversified altcoin portfolio, this dashboard transforms raw transaction data into clear, actionable visual insights. With dynamic slicers for instant filtering by Coin, Exchange, Category, and Wallet, the Crypto Portfolio Dashboard in Google Sheets gives you complete visibility into your cryptocurrency investments without needing Excel, Power BI, or any specialized software. Explore our full collection of Google Sheets Dashboard Templates for more analytics solutions.
📦 What’s Inside the Crypto Portfolio Dashboard in Google Sheets
This dashboard is organized into 6 well-structured sheet tabs, each serving a specific analytical purpose:
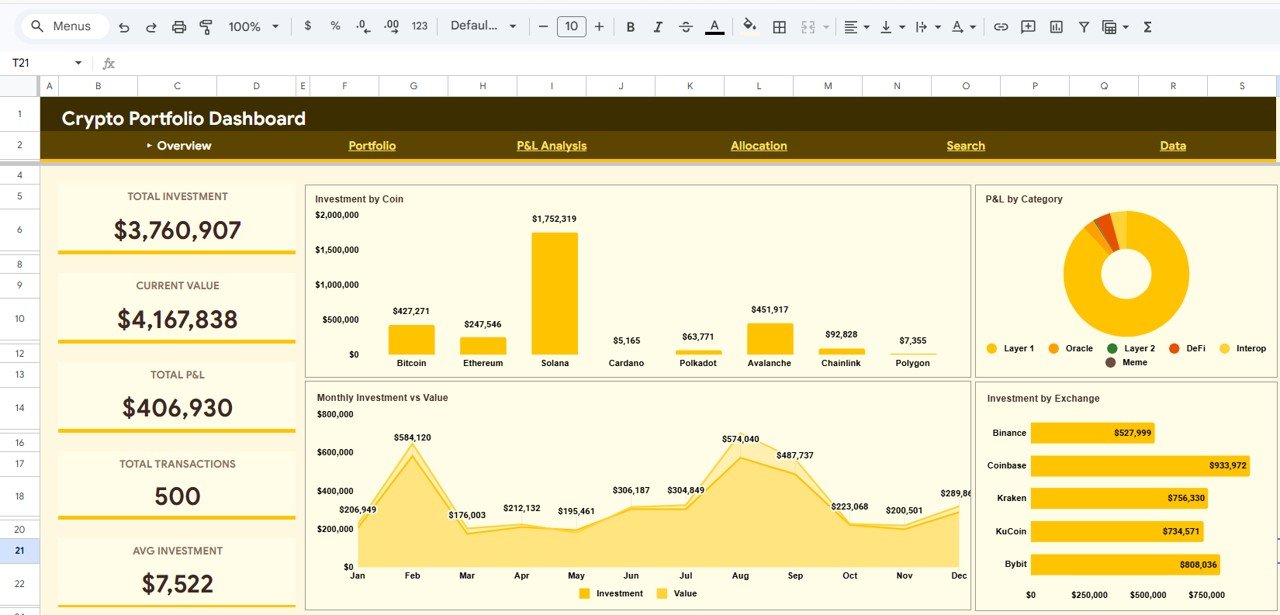
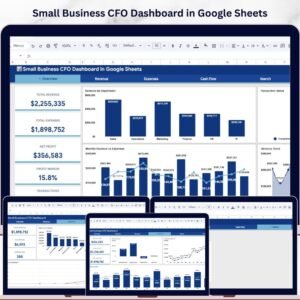
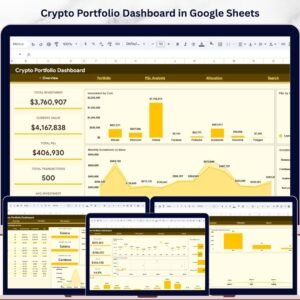
📌 Overview Page — The command center of your crypto portfolio. At the top, 5 KPI cards display Total Investment, Current Value, Total P&L, Total Transactions, and Avg Investment for an instant snapshot of portfolio health. Below the cards, interactive charts provide deeper analysis including Investment by Coin showing capital distribution across cryptocurrencies, Monthly Investment vs Value tracking monthly performance trends, P&L by Category displaying profit and loss across different crypto categories, and Investment by Exchange comparing activity across trading platforms. Multiple slicers allow instant filtering across all visuals.
 Crypto Portfolio Dashboard in Google Sheets
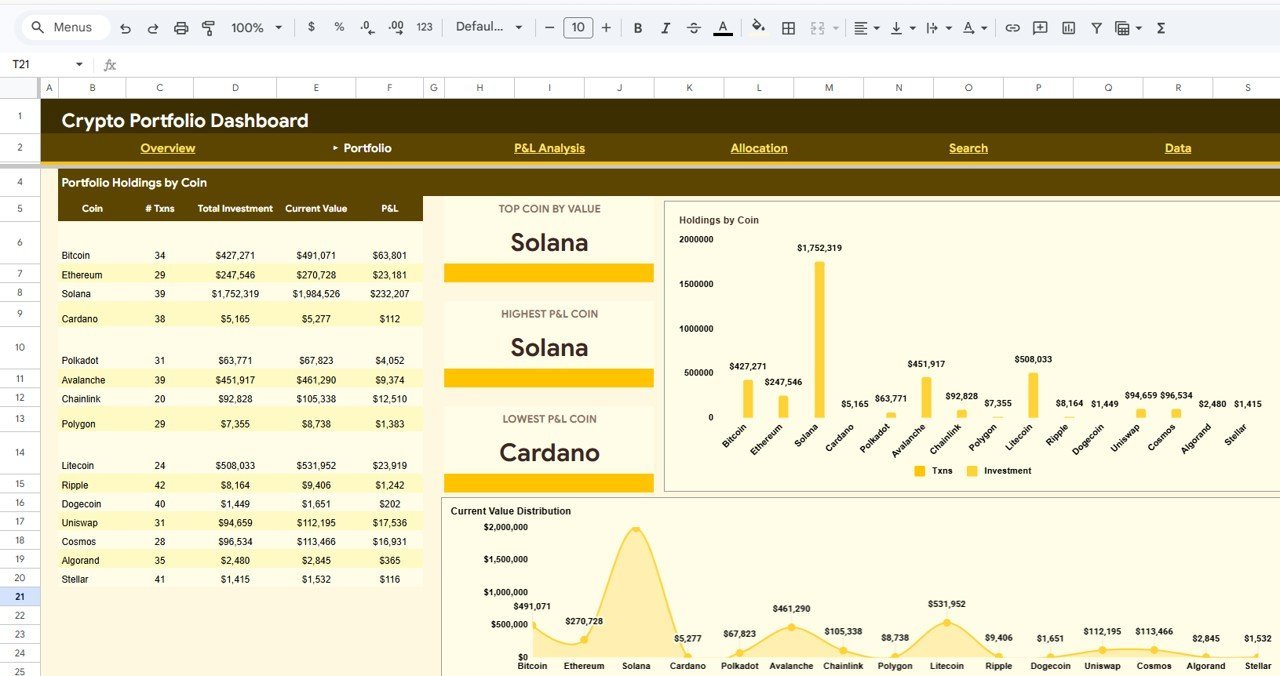
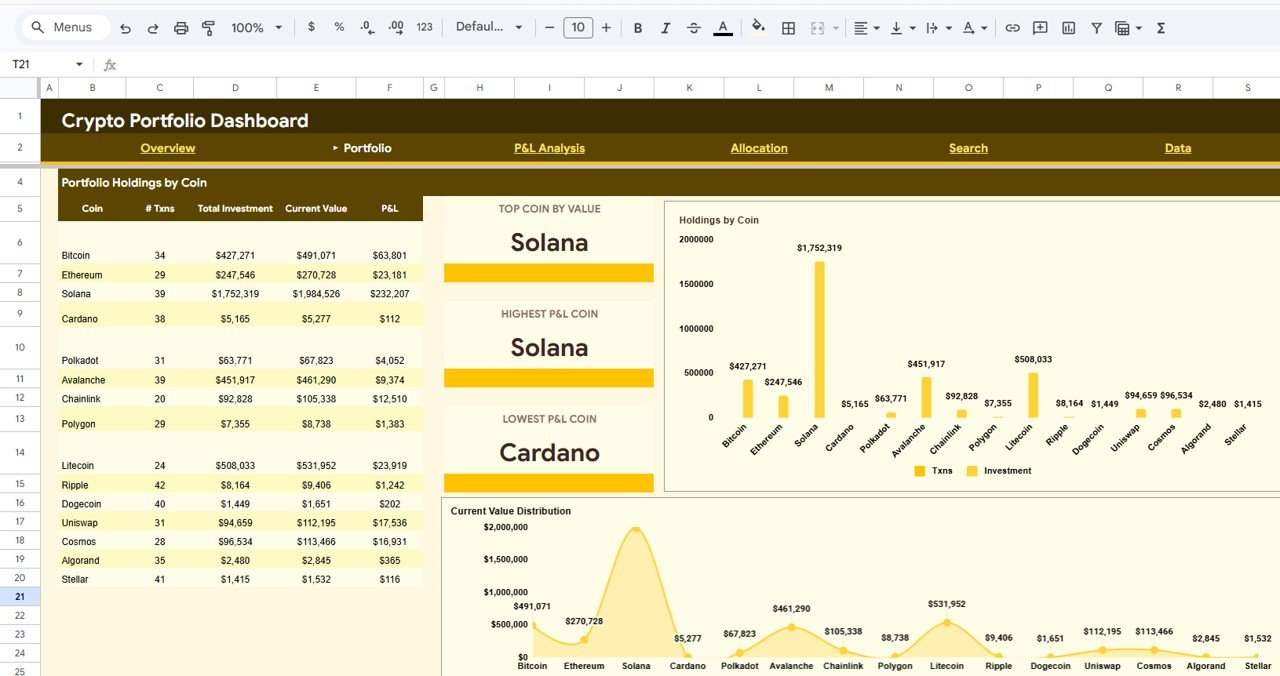
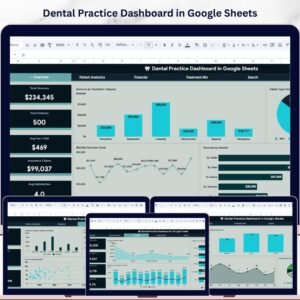
📌 Portfolio Page — Delivers deeper insight into your cryptocurrency holdings. It features Portfolio Holdings by Coin, Top Coin by Value identifying your most valuable asset, Highest P&L Coin and Lowest P&L Coin spotlighting your best and worst performers, Holdings by Coin showing quantity distribution, and Current Value Distribution revealing how your portfolio value is spread across different coins. Also check out the Crypto Portfolio Dashboard in Excel for a pivot-table-powered alternative.
 Portfolio Analysis
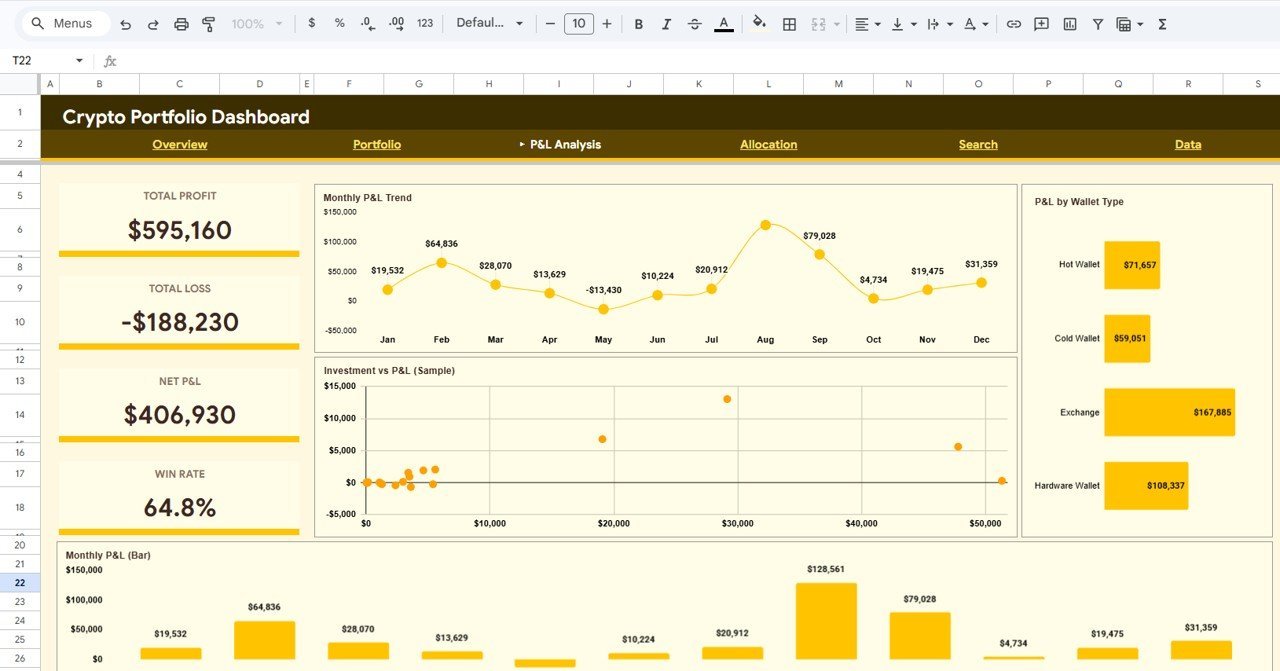
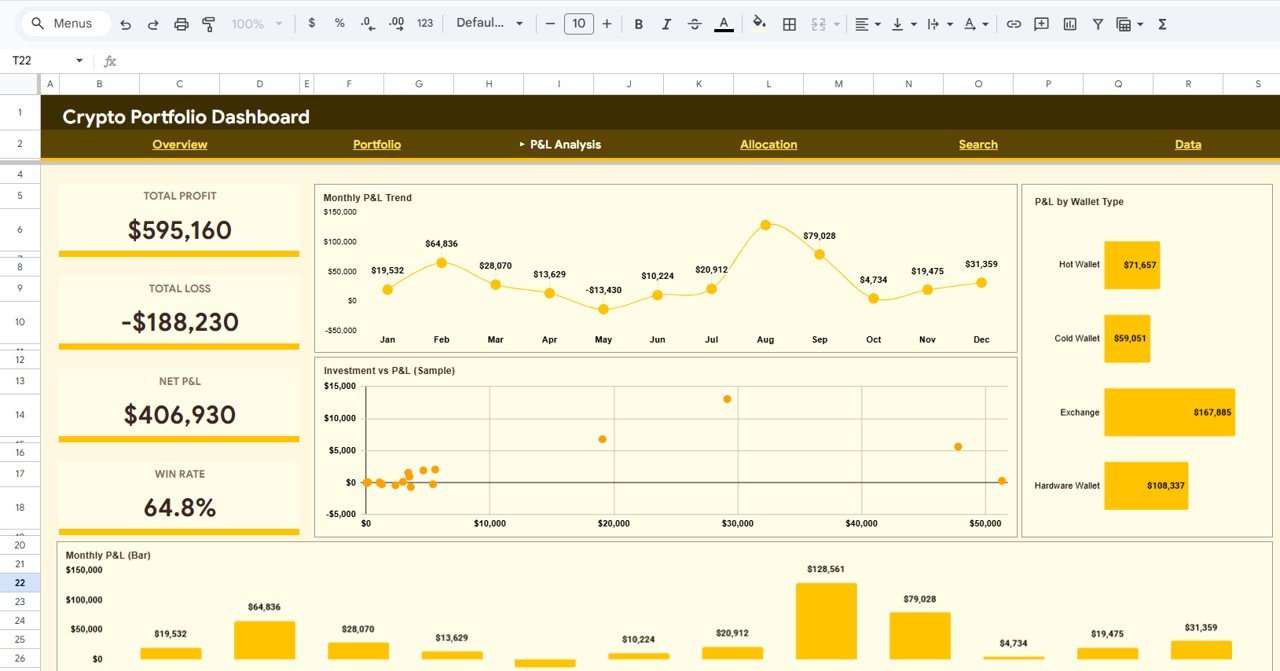
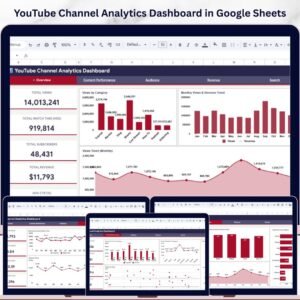
📌 P&L Analysis Page — Helps you monitor profitability across your entire portfolio. It includes Total Profit, Total Loss, Net P&L, and Win Rate KPI cards at the top. Below, the Monthly P&L Trend chart visualizes your performance month by month, Investment vs P&L (Sample) compares capital deployed against returns, P&L by Wallet Type breaks down performance across hot wallets, cold wallets, and exchange wallets, and Monthly P&L shows detailed monthly profit and loss figures. If you also manage blockchain assets, explore the Blockchain & Cryptocurrency Dashboard in Power BI.
 P&L Analysis
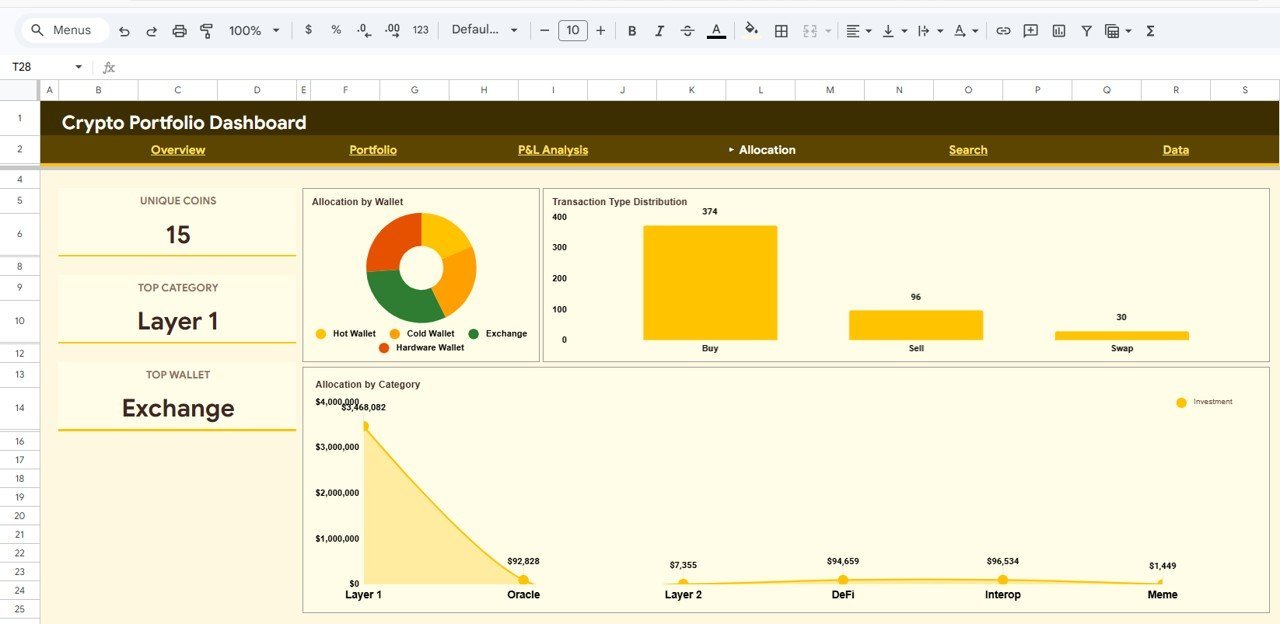
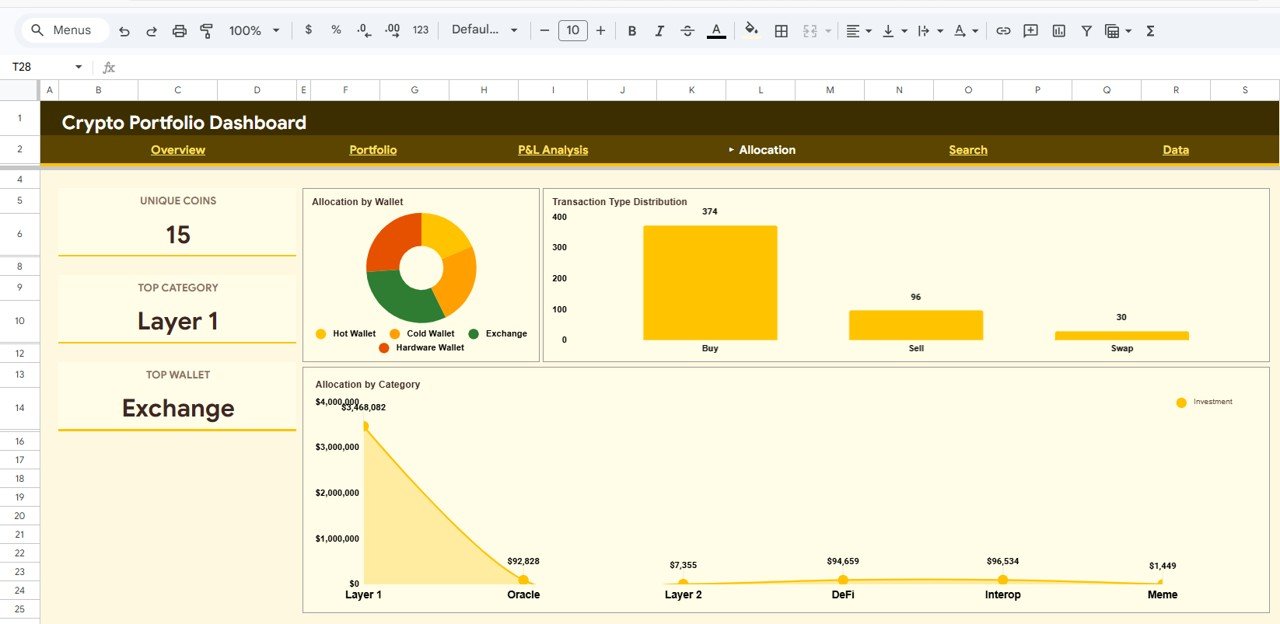
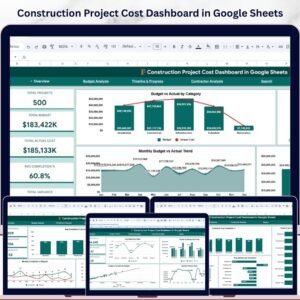
📌 Allocation Page — Provides a clear view of how your crypto capital is distributed. It displays Unique Coins count, Top Category, and Top Wallet at the top. Charts include Allocation by Wallet showing capital distribution across wallet types, Transaction Type Distribution breaking down buy, sell, and swap activities, and Allocation by Category revealing your exposure across DeFi, Layer 1, stablecoins, and other crypto categories. For a broader financial view, also explore the Net Worth Tracker in Google Sheets.
 Allocation Analysis
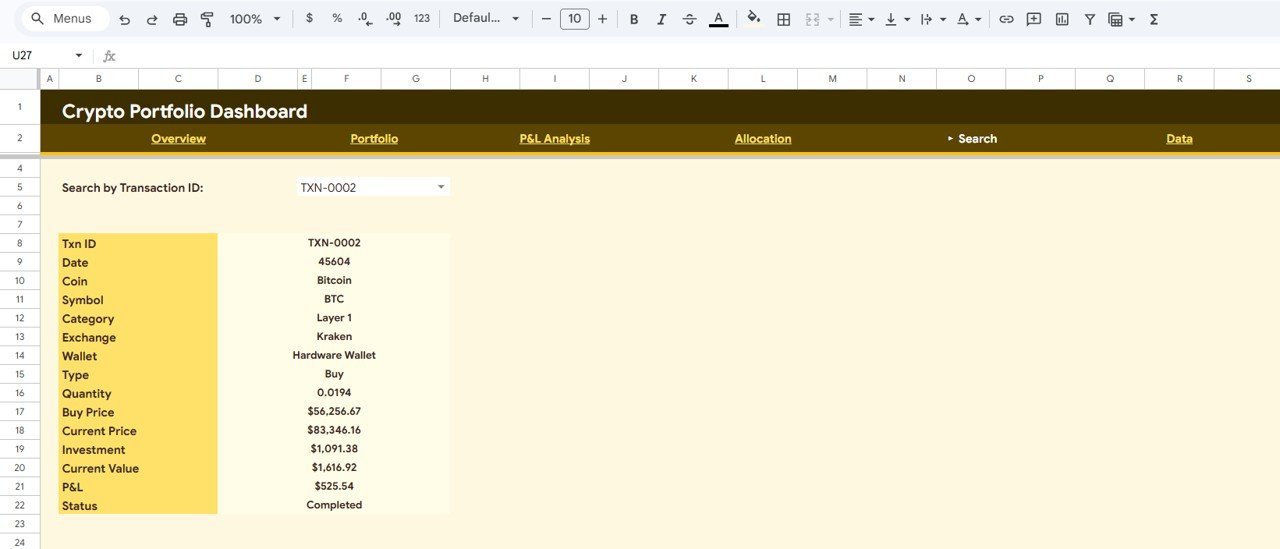
📌 Search Page — A built-in search engine for your crypto transactions. Select a Transaction ID from the dropdown and it instantly displays all details including Txn ID, Date, Coin, Symbol, Category, Exchange, Wallet, Type, Quantity, Buy Price, Current Price, Investment, Current Value, P&L, and Status. No more scrolling through hundreds of rows to find a specific transaction.
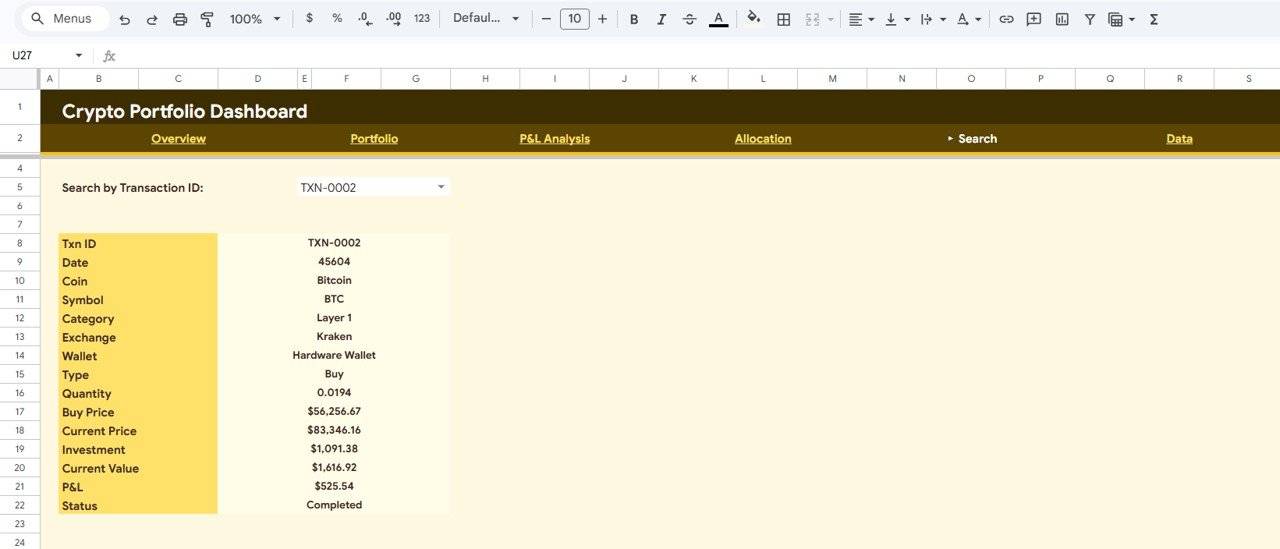 Search Sheet Tab
📌 Data Sheet — The backbone of your dashboard. This is where all your raw crypto transaction data lives. Simply add your data in the same format as the sample entries — including Date, Coin, Symbol, Category, Exchange, Wallet, Type, Quantity, Buy Price, Current Price — and the entire dashboard updates automatically.
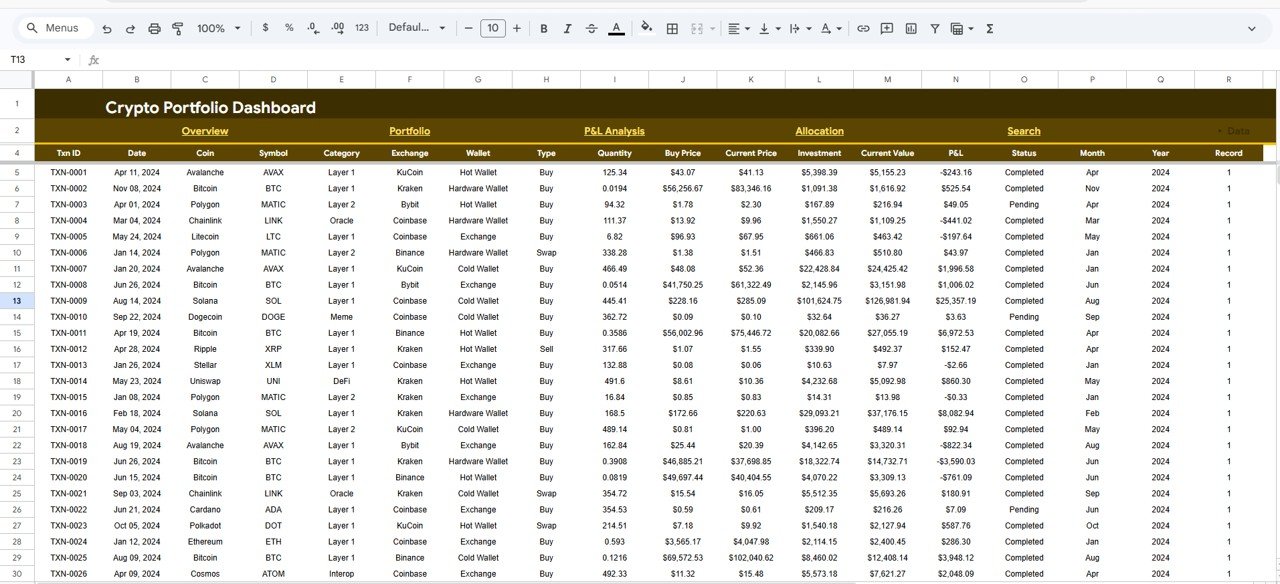 Data Sheet Tab
⚙️ How to Use the Crypto Portfolio Dashboard in Google Sheets
1️⃣ Open the PDF guide included in your download — it contains the Google Sheets copy link
2️⃣ Click the link to create your own editable copy in Google Drive
3️⃣ Navigate to the Data sheet tab and replace the sample data with your own crypto transaction records
4️⃣ All charts, KPIs, and analysis pages update automatically as you enter your data
5️⃣ Use the slicers on the Overview page to filter by Coin, Exchange, Category, or Wallet
6️⃣ Use the Search page to find specific transactions by Transaction ID
👥 Who Can Benefit from This Crypto Portfolio Dashboard
📊 Retail crypto investors tracking personal portfolios across multiple coins and exchanges
📊 Day traders and swing traders monitoring P&L, win rates, and monthly performance
📊 Portfolio managers overseeing diversified cryptocurrency holdings for clients
📊 Financial advisors who need clean, visual crypto reports for client presentations
📊 DeFi enthusiasts tracking allocations across different blockchain categories and wallets
📊 Students and researchers analyzing crypto market trends with structured data
❓ Frequently Asked Questions
What KPIs does the Crypto Portfolio Dashboard in Google Sheets track?
The Crypto Portfolio Dashboard in Google Sheets tracks 5 key metrics on the Overview page: Total Investment, Current Value, Total P&L, Total Transactions, and Avg Investment. The P&L Analysis page adds Total Profit, Total Loss, Net P&L, and Win Rate. Across 4 dashboard pages, it includes 10+ interactive charts covering investment breakdown, portfolio holdings, P&L trends, wallet allocation, and exchange distribution.
Do I need advanced Google Sheets skills to use this dashboard?
No. Simply open the Google Sheets copy link from the included PDF guide, replace the sample data with your own crypto transaction records, and all charts and KPIs update automatically. No formulas, coding, or advanced skills are required.
What is the best Google Sheets template for tracking cryptocurrency investments?
The Crypto Portfolio Dashboard in Google Sheets from NextGenTemplates is one of the most comprehensive Google Sheets crypto analytics templates available. It includes 4 dedicated analysis pages covering Overview, Portfolio, P&L Analysis, and Allocation, plus a Search page and Data sheet — all running in Google Sheets with automatic formulas and interactive charts.
Can I track multiple coins and exchanges in this dashboard?
Yes. The dashboard supports unlimited coins and exchanges. Each transaction is recorded with Coin, Symbol, Category, Exchange, and Wallet fields. The slicers allow you to filter by any combination to analyze specific subsets of your portfolio instantly.
Is this dashboard available in Excel or Power BI as well?
Yes. NextGenTemplates offers the same Crypto Portfolio Dashboard in four formats: Google Sheets, Excel, Power BI, and HTML. Choose the platform that best fits your workflow.
🔗 Explore Related Templates
🔹 Crypto Portfolio Dashboard in Excel — Pivot-table-powered crypto portfolio tracking in Microsoft Excel with support sheets and macros.
🔹 Crypto Portfolio Dashboard in Power BI — Advanced Power BI crypto analytics with DAX measures and interactive filtering.
🔹 Net Worth Tracker in Google Sheets — Track your complete financial net worth including crypto, real estate, and stocks.
📖 Click here to read the Detailed Blog Post
Watch the step-by-step video tutorial:


Reviews
There are no reviews yet.