

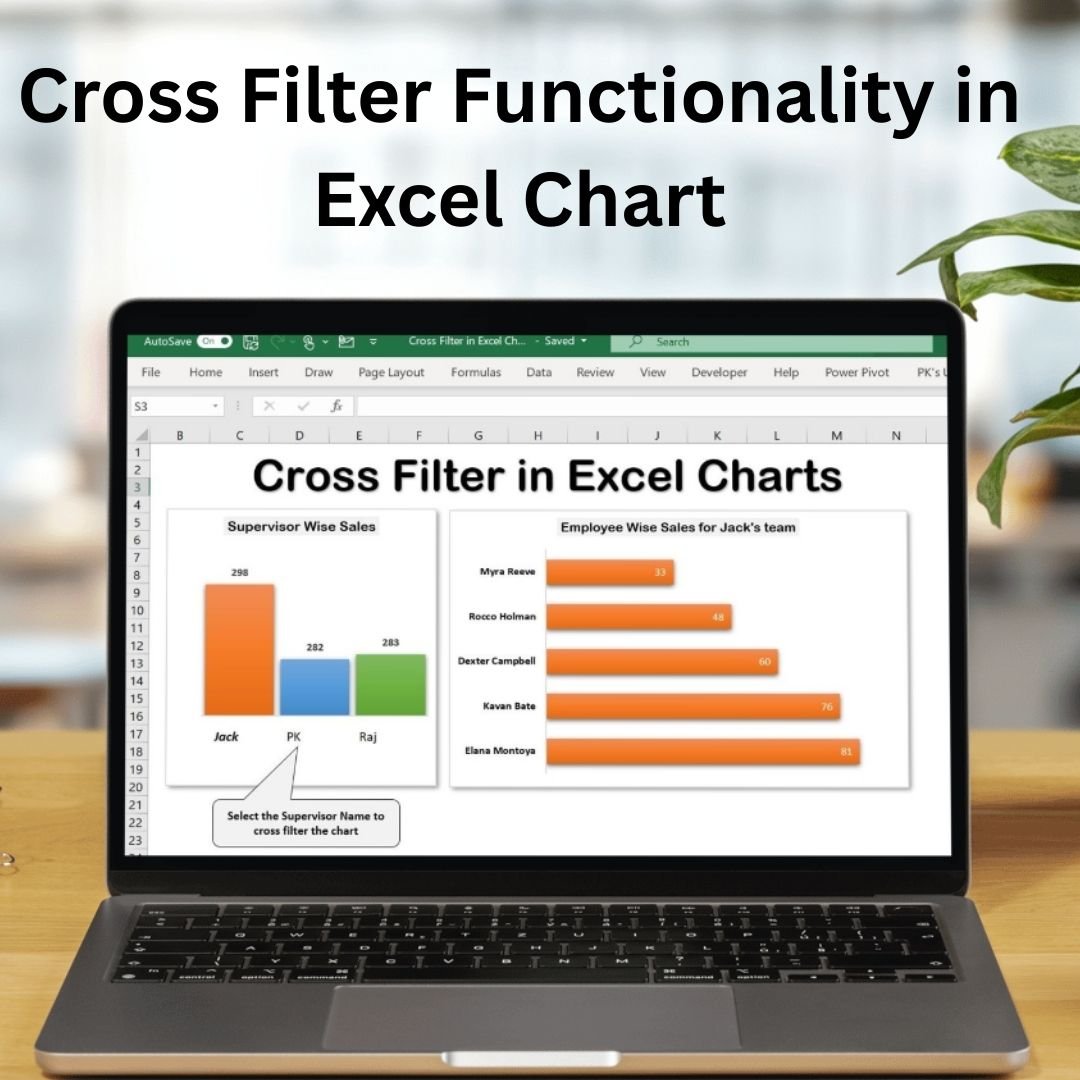

The Cross Filter Functionality in Excel Chart is an innovative tool designed to enhance your data visualization experience. With this functionality, you can interactively filter multiple data series within an Excel chart, enabling you to explore data from different perspectives and draw deeper insights. This feature allows you to filter data across various dimensions—whether by categories, time periods, or any other criteria—making your charts more dynamic and engaging.
The Cross-Filter Functionality is particularly useful for dashboards and reports, where you need to visualize complex datasets and adjust data views without constantly changing the chart setup. This tool empowers users to work smarter, analyze trends, and present data in a clear, accessible manner. Whether you’re tracking sales, performance metrics, or customer data, this feature provides a more efficient and interactive way to engage with your charts.
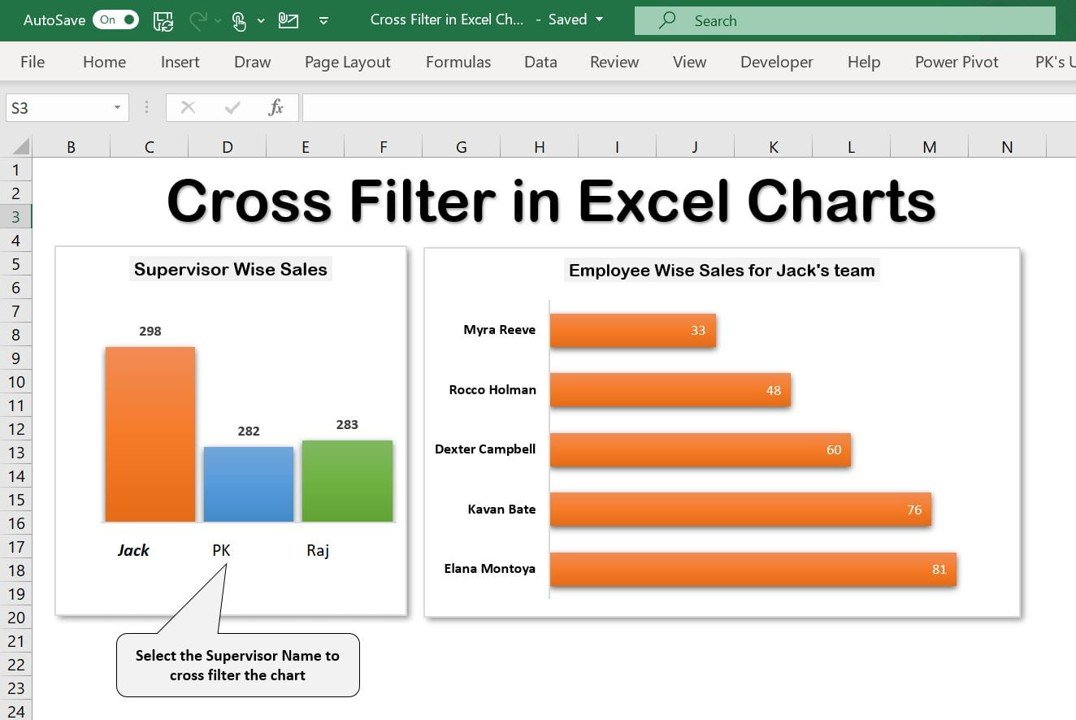
Key Features of the Cross-Filter Functionality in Excel Chart
📌 Interactive Data Filtering
The cross-filter functionality allows you to click on chart elements (e.g., bars, columns, or slices) to filter and display data dynamically. For example, you can click on a specific bar in a bar chart to highlight related data points in other parts of the chart, making it easier to focus on a specific subset of data.
🛠 Multiple Data Series Filtering
With the cross-filter feature, you can filter multiple data series simultaneously, providing a more holistic view of your data. This is particularly useful when you have multiple dimensions (such as sales, profit, and quantity) and want to examine how one affects the other in real time.
💡 Customizable Chart Interactivity
Customize your Excel charts with the ability to add dynamic interactivity. Whether you’re working with pie charts, bar graphs, or line charts, the cross-filtering functionality lets you engage with the data without making manual adjustments, saving you time and effort.
🔢 Quick Insights and Data Exploration
As you filter data within the chart, you get quick insights into how your data behaves under different conditions. You can easily explore trends, identify correlations, and examine how changes in one variable affect the others in real time.
🚀 Dynamic and Real-Time Updates
This functionality ensures that once you click on a chart element, your other charts and tables update instantly. This real-time update feature allows for smoother data exploration and provides an up-to-date view of your data without requiring constant reconfiguration.
📊 Enhanced Data Presentation
Using cross-filtering makes your data presentation more engaging. By allowing users to interact with your charts, you provide them with the tools to explore data on their own, making it easier for them to identify key trends and relationships.
⚙ Simple Setup and Customization
Setting up cross-filter functionality in your Excel chart is straightforward. You can apply it to your existing charts with just a few steps, and customize it according to your needs. No advanced coding or complex formulas are required.
🚀 Why You’ll Love the Cross-Filter Functionality in Excel Chart
✅ Interactive Data Exploration – Filter data dynamically to uncover deeper insights. ✅ Multiple Data Series Filtering – Analyze several data series at once, and understand relationships between them. ✅ Real-Time Updates – Instantly see changes as you click and filter chart elements. ✅ Customizable and Flexible – Tailor interactivity to suit your presentation or analysis needs. ✅ Easy Setup – Simple steps to add cross-filter functionality to your charts without complex formulas.
📂 What’s Inside the Cross-Filter Functionality in Excel Chart?
- Interactive Chart Filters: Enable dynamic filtering of chart elements with a simple click.
- Multiple Data Series: Filter multiple datasets simultaneously for a more holistic view.
- Real-Time Updates: Instant visual updates as you interact with the data.
- Customizable Options: Adjust the functionality according to your needs.
- Easy Setup Instructions: Clear, step-by-step guide to adding cross-filtering to your charts.
🔍 How to Use the Cross-Filter Functionality in Excel Chart
1️⃣ Download the Template – Instant access to the Excel file upon purchase. 2️⃣ Create or Use an Existing Chart – Open your Excel file and either use an existing chart or create a new one. 3️⃣ Apply Cross-Filter – Follow the simple steps to add the cross-filter functionality to your chart. 4️⃣ Interact with Your Data – Click on elements within the chart to filter and explore related data dynamically. 5️⃣ Present and Share – Share your interactive charts in reports or presentations for an engaging data experience.
🎯 Who Can Benefit from the Cross-Filter Functionality in Excel Chart? 🔹 Business Analysts
🔹 Data Scientists
🔹 Sales and Marketing Teams
🔹 Project Managers
🔹 Financial Analysts
🔹 Anyone presenting or analyzing large datasets in Excel
Unlock the power of interactive data exploration with the Cross-Filter Functionality in Excel Chart. This tool allows you to present your data in a more dynamic and engaging way, helping you analyze trends and relationships with ease.
Click here to read the Detailed blog post
https://www.pk-anexcelexpert.com/cross-filter-functionality-in-excel-chart/











Reviews
There are no reviews yet.