In today’s conscious business environment, organizations are not just judged by their profits but also by their positive impact on society, the environment, and governance. If your business is committed to meaningful CSR goals, tracking progress is essential.
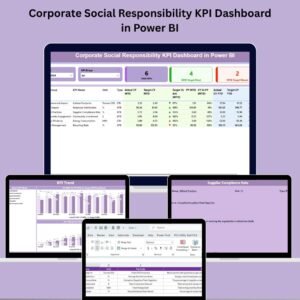
Introducing the Corporate Social Responsibility KPI Dashboard in Power BI — a powerful, interactive reporting tool built for sustainability leaders, CSR professionals, and compliance teams. This dashboard empowers you to visualize, analyze, and improve your CSR initiatives with real-time data and actionable insights.
Whether you’re focusing on social programs, environmental metrics, or governance standards, this dashboard helps you measure your progress with confidence.
🛠️ Key Features of Corporate Social Responsibility KPI Dashboard in Power BI

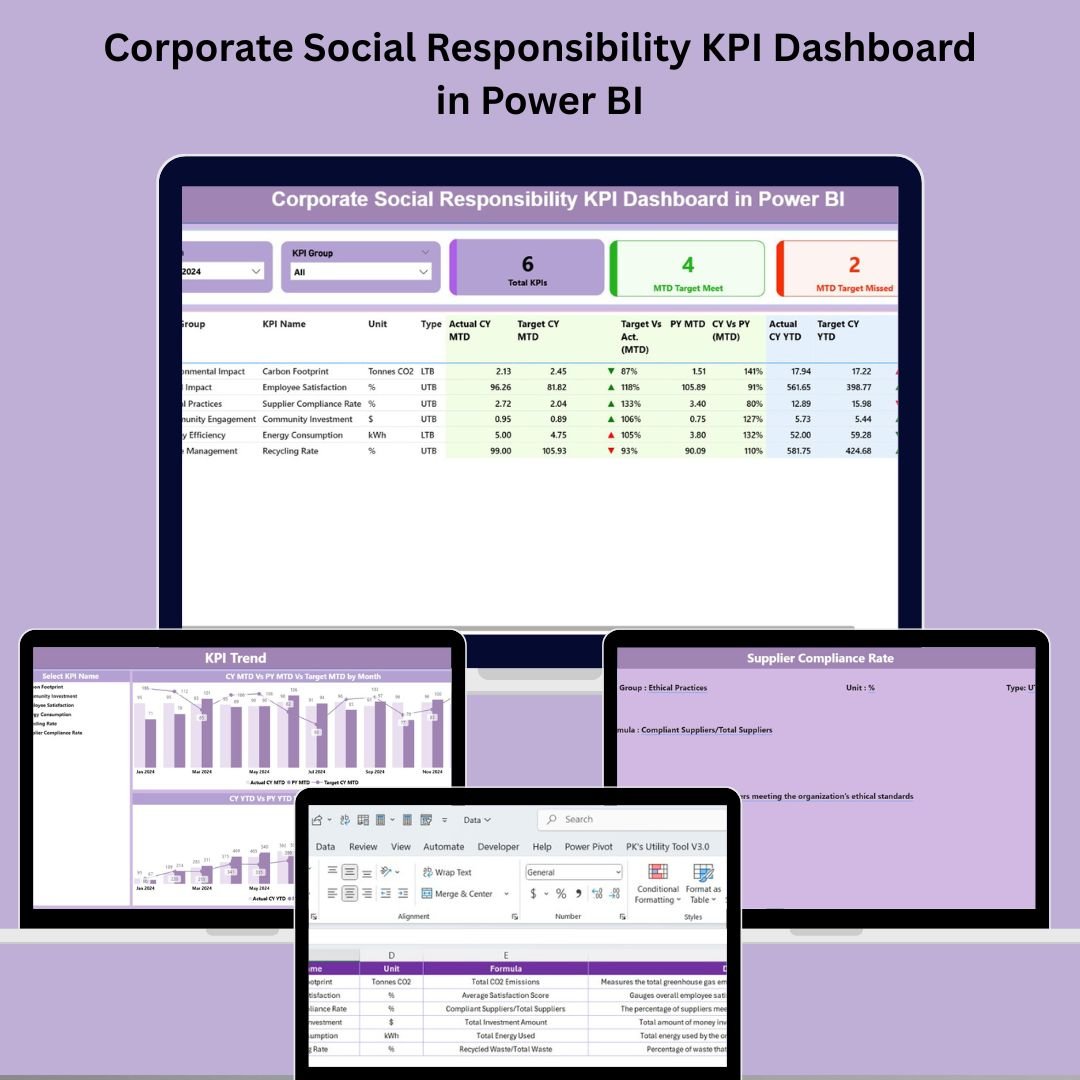
📊 Summary Page – Centralized CSR Performance Snapshot
Track all KPIs in one place. Filter by Month and KPI Group, and monitor both MTD (Month-To-Date) and YTD (Year-To-Date) performance.
✅ KPI Overview Cards
Quickly view:
-
Total KPIs count
-
MTD Target Met
-
MTD Target Missed
📋 Interactive KPI Table
Dive deep into:
-
KPI Number, Name, Group, Unit, and Type (UTB or LTB)
-
Actual vs Target (MTD & YTD)
-
Previous Year MTD/YTD comparisons
-
% Differences across timelines
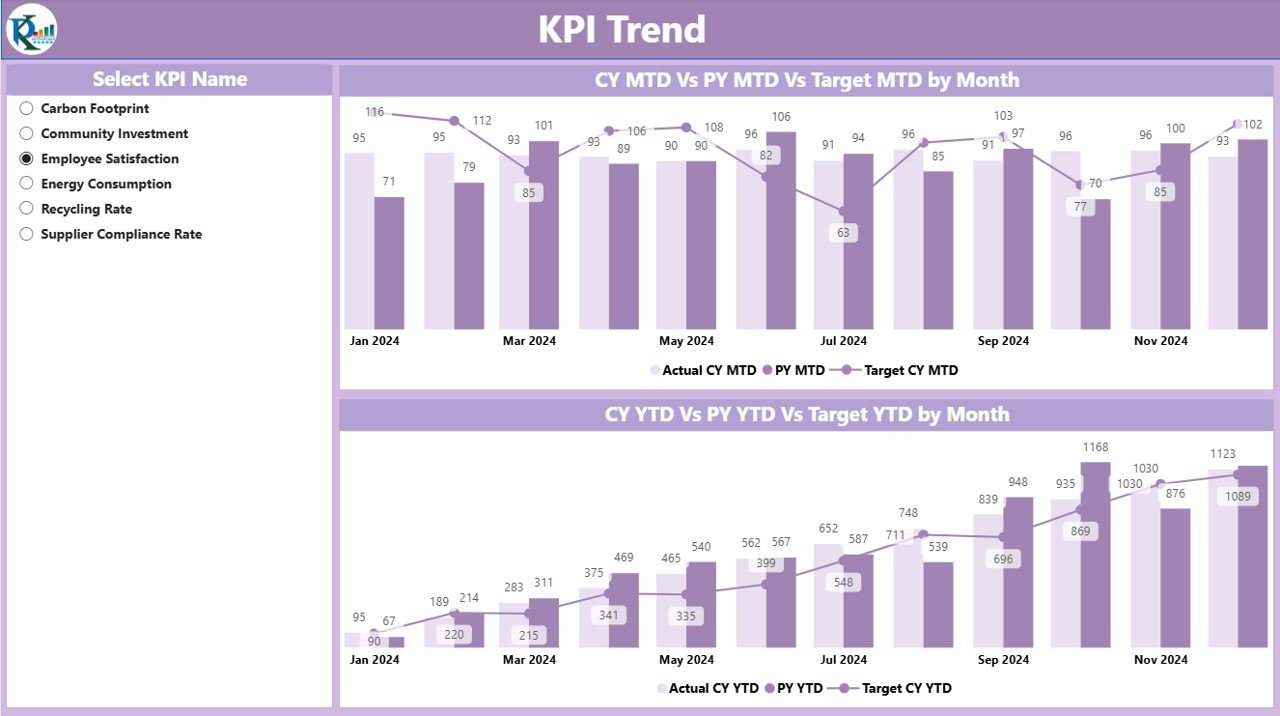
📈 KPI Trend Page – Visualize Performance Over Time
Use combo charts to analyze:
-
Actual values (Current Year & Previous Year)
-
Target benchmarks
-
MTD and YTD comparisons for each KPI
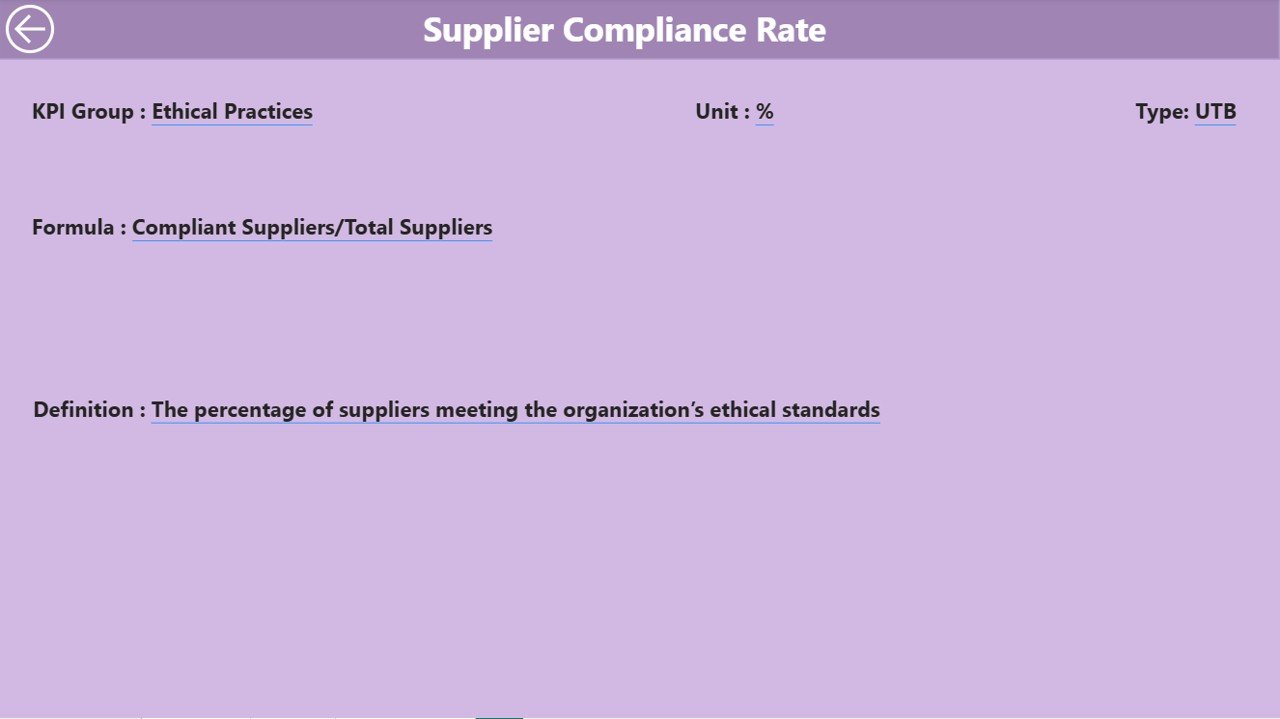
🎯 Drill-Through Analysis
Click on any KPI to see its formula, unit, type, and detailed definition on the KPI Definition Page. Perfect for transparency and clarity.
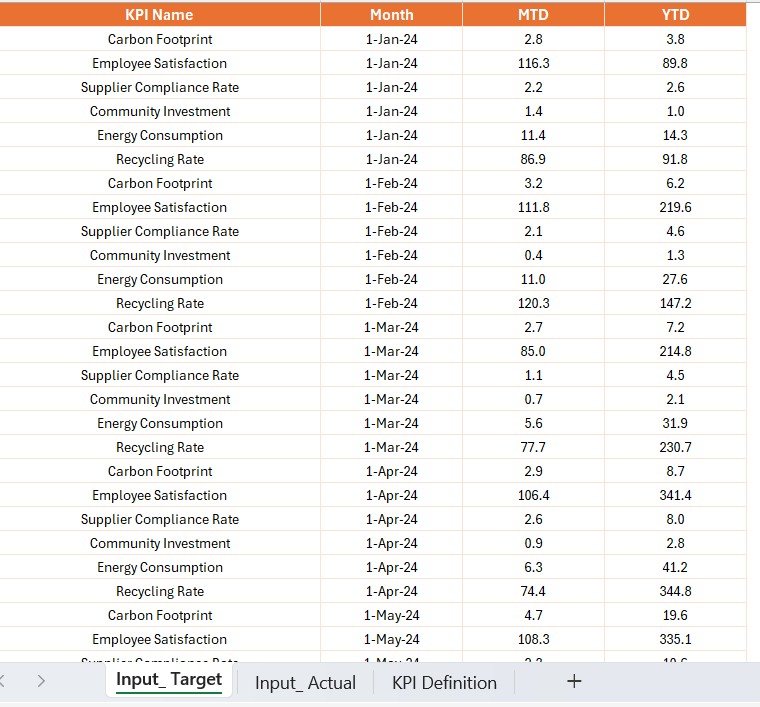
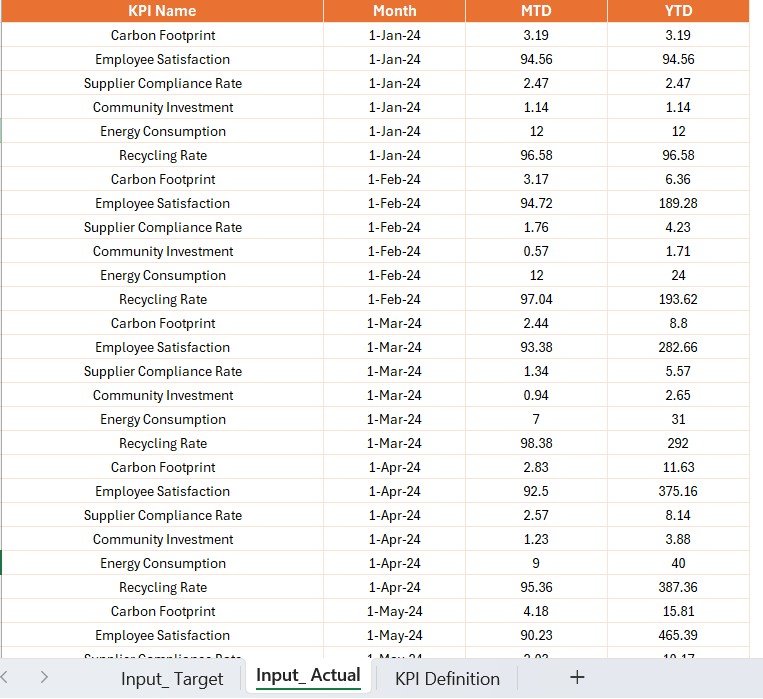
📥 Excel Data Integration
Easy to update with 3 structured sheets:
-
Input_Actual: Add actual MTD/YTD data -
Input_Target: Set performance goals -
KPI Definition: Maintain KPI metadata
📦 What’s Inside the CSR Dashboard Package?
🗂️ Summary Page
Filter by KPI Group and Month. Instantly see which KPIs are performing well and where you’re falling short.
📊 KPI Trend Page
Select a specific KPI and review trend lines showing how current values compare to targets and historical figures.
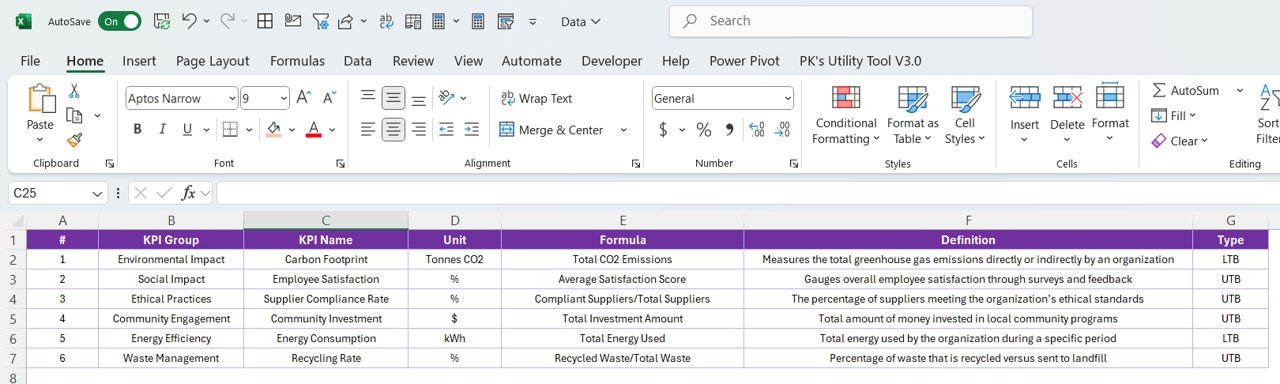
📘 KPI Definition Page
Understand the logic behind every KPI with formula breakdowns and definitions.
📈 Real-Time Visual Feedback
Color-coded visuals (green for positive performance, red for concerns) make insights intuitive.
🧾 Excel Integration
Update once in Excel, and all Power BI visuals reflect the change. Seamless, structured, and efficient!
📌 How to Use the Dashboard
✔️ Step 1: Enter actual values into Input_Actual.xlsx
✔️ Step 2: Set realistic goals in the Input_Target sheet
✔️ Step 3: Maintain KPI logic in the KPI Definition tab
✔️ Step 4: Open the Power BI file and refresh to see results
✔️ Step 5: Use filters, slicers, and drill-through to analyze performance deeply
👥 Who Can Benefit from This Dashboard?
✅ CSR Managers – Oversee and evaluate community, environmental, and social initiatives
✅ Sustainability Officers – Track energy, emissions, and water usage against goals
✅ Compliance Teams – Ensure governance KPIs are met
✅ ESG Analysts – Monitor performance for ESG reporting
✅ Executives – Make informed, ethical business decisions based on reliable CSR data
✅ Consultants & NGOs – Present CSR results to stakeholders in a clean, visual format
🚀 Whether you’re preparing reports for investors, regulatory bodies, or internal teams—this dashboard ensures that your CSR efforts are data-backed, transparent, and performance-driven.
🔗 Click here to read the Detailed blog post
🎥 Visit our YouTube channel to learn step-by-step video tutorials


Reviews
There are no reviews yet.