Consumer electronics service teams don’t just fix devices—they protect your brand reputation. Customers expect fast response, quick resolution, and a smooth service experience every single time. But when service tracking is scattered across files and manual reports, the result is predictable: delays increase, costs rise, customer satisfaction drops, and managers lose control.
That’s why we created the Consumer Electronics Service Dashboard in Excel 🔧📊
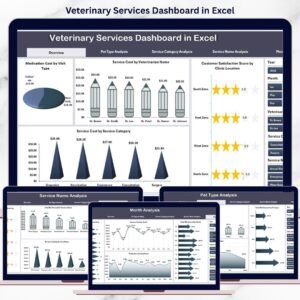
It’s a ready-to-use analytics template that converts raw service records into clear, interactive insights—so you can monitor service performance, customer satisfaction, service costs, and revenue from one centralized dashboard.
Whether you manage a manufacturer service network, a repair franchise, or a customer support team, this dashboard helps you answer the questions that matter most:
-
How many service requests are coming in—and how many are completed?
-
Which products create the most service pressure?
-
Which service types are slow and expensive?
-
Which channels deliver the best experience?
-
Where is customer satisfaction falling—and why?
-
What’s happening month-by-month, and what should we fix next?
Instead of spending hours preparing reports, you get instant visibility and faster decision-making—using a tool your team already knows: Excel.
Key Feature of Consumer Electronics Service Dashboard in Excel
🚀 Ready-to-use Excel dashboard for service operations and performance analytics
🧭 Page Navigator on the left for quick movement across analysis pages
🎛️ Right-side slicers for dynamic filtering and instant insights
📌 KPI cards + key charts for daily performance monitoring
⚠️ High Priority Level % tracking to identify urgent service load quickly
😊 Customer Satisfaction analysis by region, product, type, and channel
💰 Service Cost + Revenue visibility to improve profitability and cost control
⏱️ Average Resolution Time insights to reduce delays and improve SLA performance
📦 Product Category analysis to find defect-prone and high-cost categories
🔁 Monthly trend analysis to predict demand and prepare resources
📂 Structured backend sheets (Data + Support) for smooth automation and refresh
What’s Inside the Consumer Electronics Service Dashboard in Excel
This dashboard includes 5 powerful analytical pages, each built to highlight a different service performance angle:
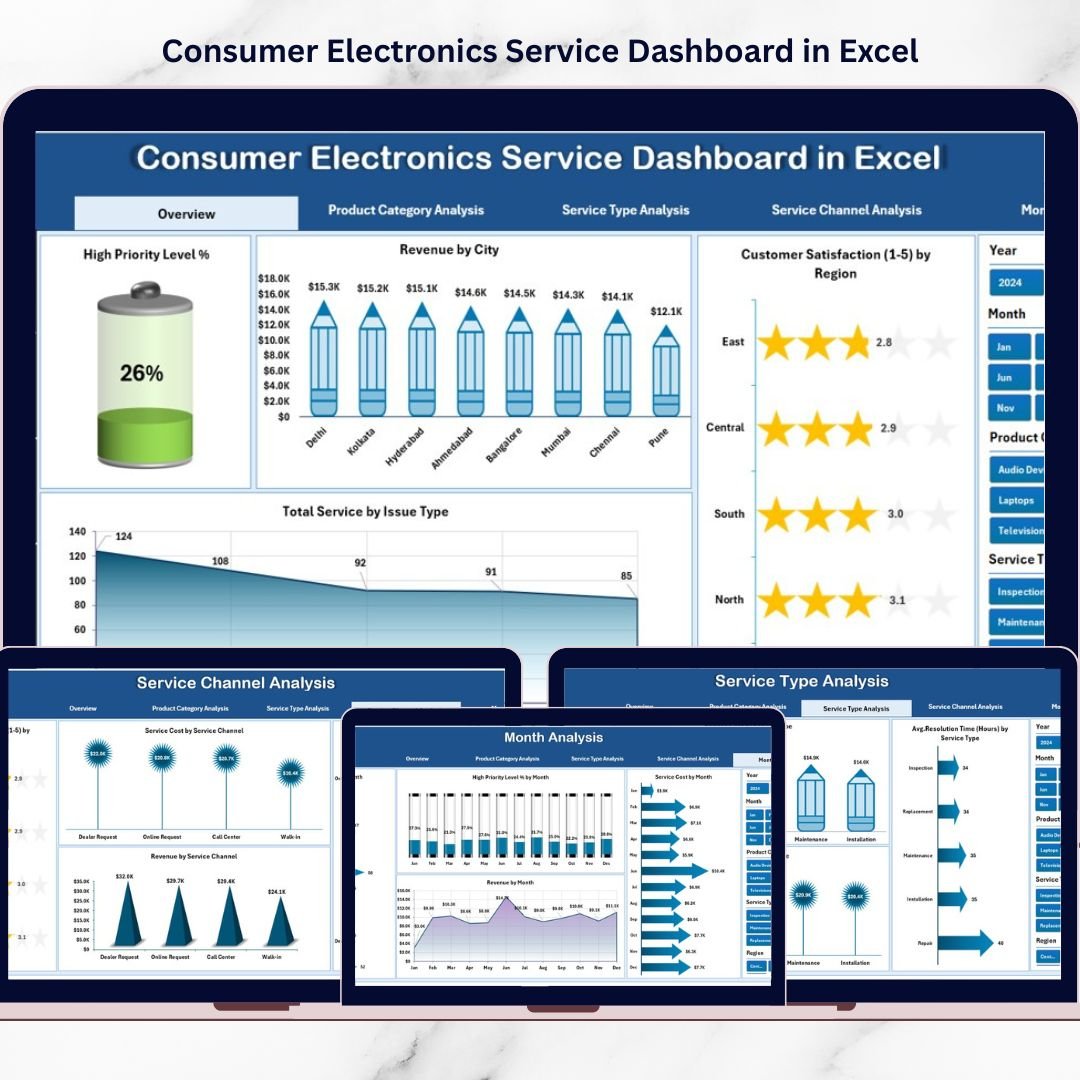
📌 1) Overview Page (Complete Service Snapshot)
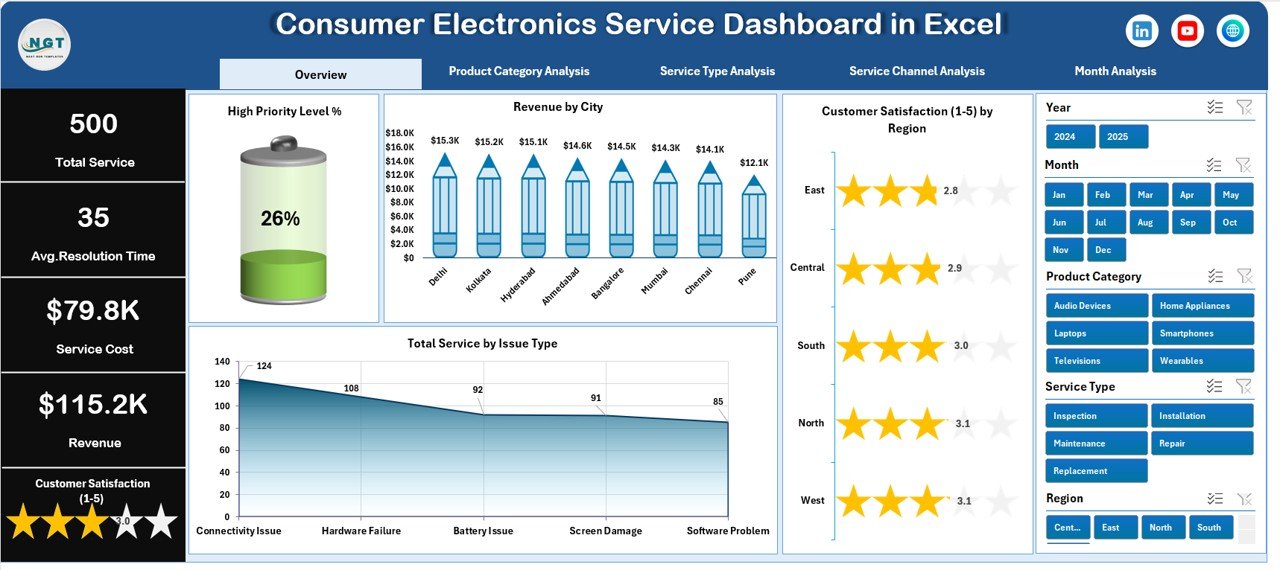
Your main control center with slicers, KPI cards, and four high-impact visuals:
-
High Priority Level %
-
Revenue by City
-
Customer Satisfaction by Region
-
Total Service by Issue Type
Perfect for daily monitoring and quick leadership reviews.
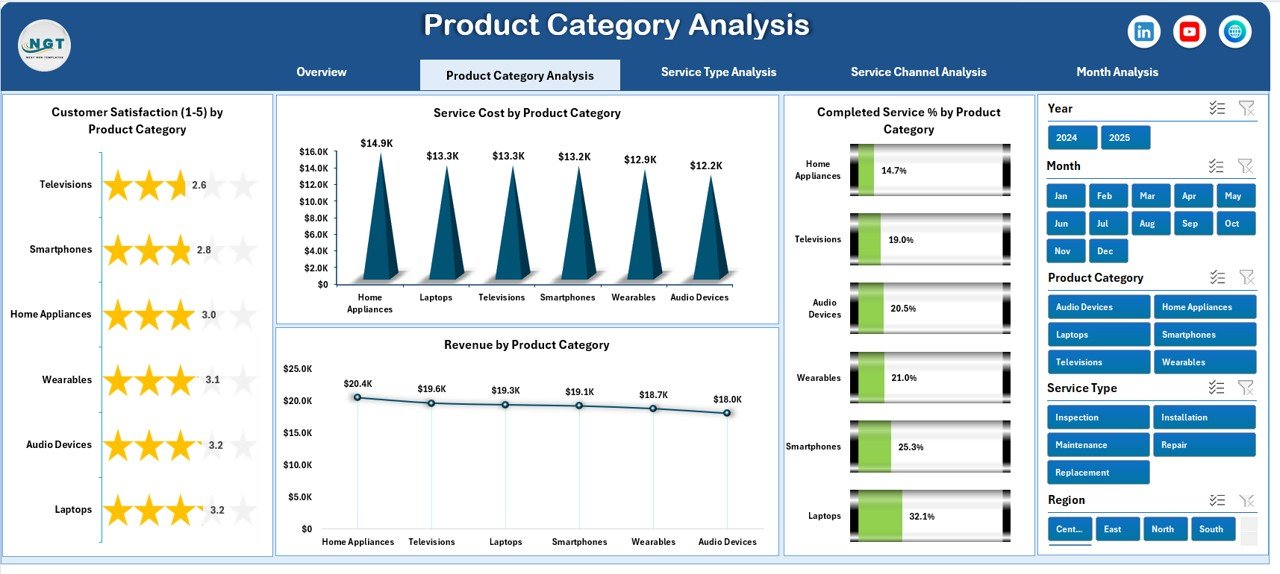
📦 2) Product Category Analysis (Which Products Need More Service?)
Spot product categories causing service pressure using:
-
Customer Satisfaction by Product Category
-
Service Cost by Product Category
-
Completed Service % by Product Category
-
Revenue by Product Category
This helps your product and service teams reduce repeat issues and focus quality improvements.
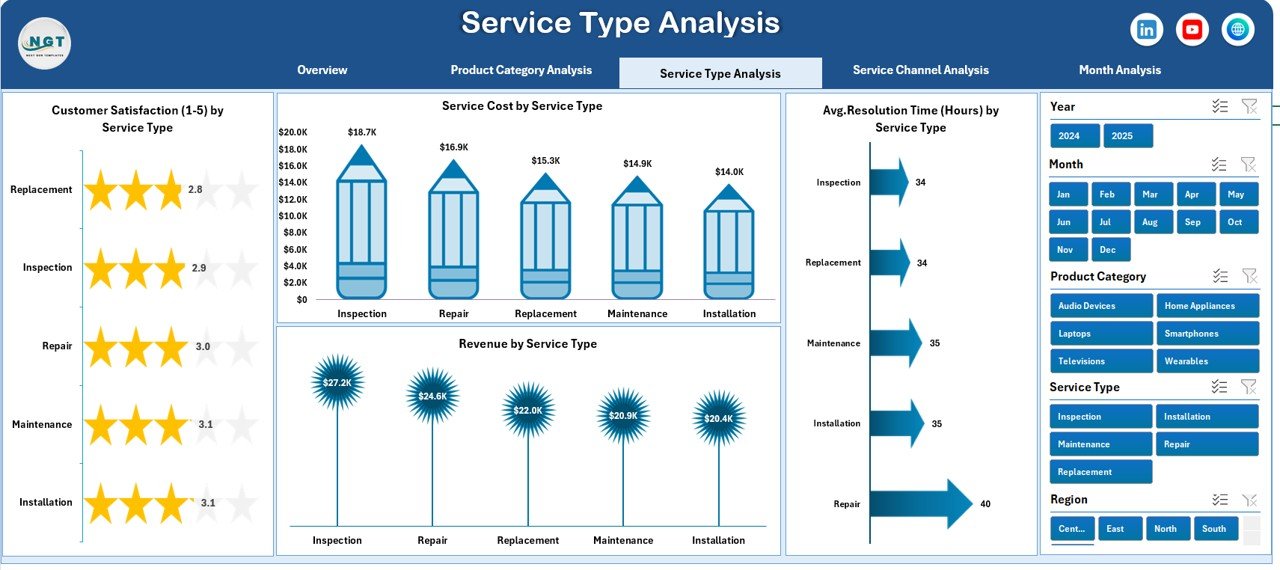
🧰 3) Service Type Analysis (How Efficient Are Service Operations?)
Compare repair, installation, maintenance, and replacement performance with:
-
Customer Satisfaction by Service Type
-
Service Cost by Service Type
-
Average Resolution Time by Service Type
-
Revenue by Service Type
This page is ideal for identifying which service types are slow, costly, or hurting customer satisfaction.
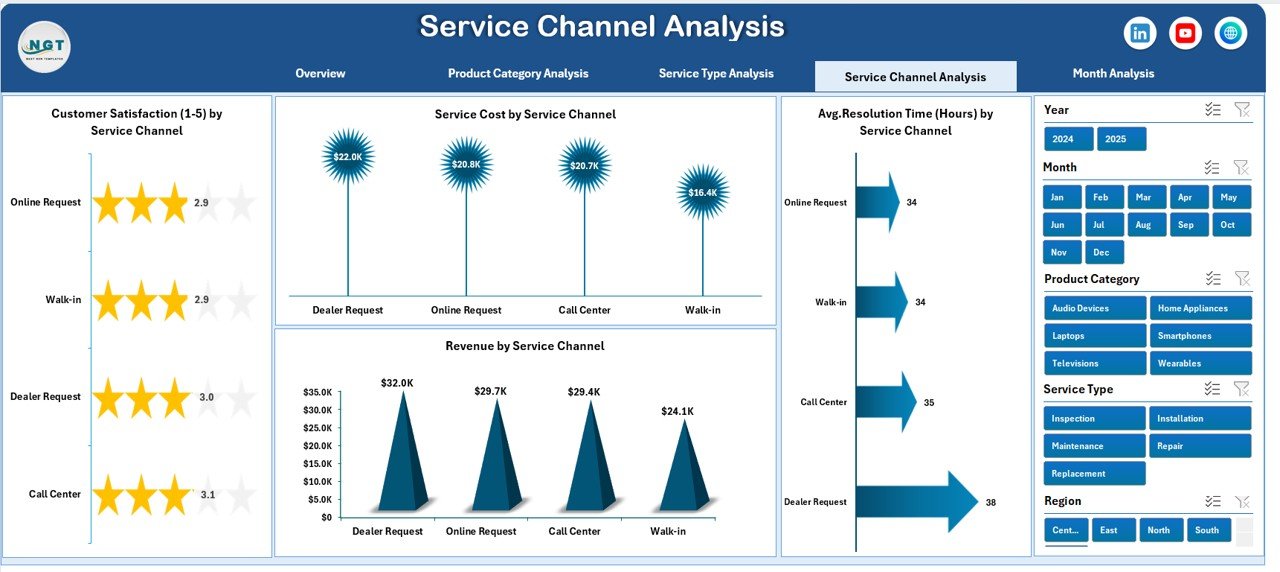
📞 4) Service Channel Analysis (Which Channel Performs Best?)
Analyze service requests coming from online, call center, service center, and partner vendors using:
-
Customer Satisfaction by Service Channel
-
Service Cost by Service Channel
-
Average Resolution Time by Service Channel
-
Revenue by Service Channel
This reveals where you should invest more—and which channel needs process improvement.
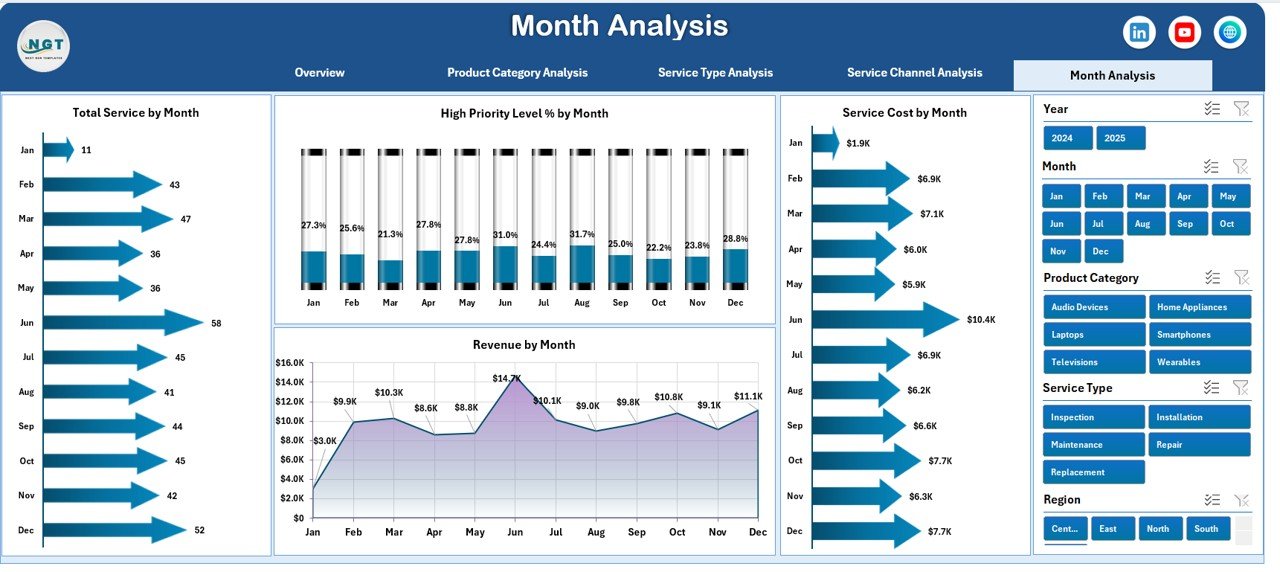
📅 5) Month Analysis (Trends Over Time)
Track monthly patterns to forecast workload and budget:
-
High Priority Level by Month
-
Service Cost by Month
-
Total Service by Month
-
Revenue by Month
📂 Supporting Sheets
-
Data Sheet: service records such as Service ID, category, type, channel, city/region, cost, revenue, satisfaction, resolution time, priority, service date
-
Support Sheet: backend calculations, helper formulas, and reference structure that powers visuals
How to Use the Consumer Electronics Service Dashboard in Excel
It’s simple and repeatable:
1️⃣ Enter service records into the Data Sheet
2️⃣ Refresh calculations/pivots (if needed) to update visuals
3️⃣ Use slicers to filter by region, product, service type, channel, or month
4️⃣ Review KPI cards and charts to spot delays, cost spikes, and satisfaction drops
5️⃣ Take action to improve resolution time, reduce high-priority backlog, and optimize service costs
Who Can Benefit from This Consumer Electronics Service Dashboard in Excel
This dashboard is ideal for:
🧑💼 Service Managers & Service Heads
📞 Customer Support Teams
⚙️ Operations Managers
🏭 Electronics Manufacturers
🔧 Repair Service Providers
📊 Business Analysts & MIS Teams
🏪 Franchise Service Networks
If you want stronger service control, faster reporting, and happier customers—this dashboard fits perfectly.
Click hare to read the Detailed blog post
Visit our YouTube channel to learn step-by-step video tutorials
Youtube.com/@PKAnExcelExpert