In today’s fast-paced consulting world, staying on top of performance metrics is essential for success. The Consulting KPI Dashboard in Excel is a powerful, ready-to-use performance management tool designed to help consulting firms measure, track, and analyze key business indicators in one interactive file. Whether you manage a small team or a large advisory firm, this Excel-based dashboard gives you the clarity and control you need to make smarter, data-driven decisions.Consulting KPI Dashboard in Excel
💡 Key Features of the Consulting KPI Dashboard in Excel
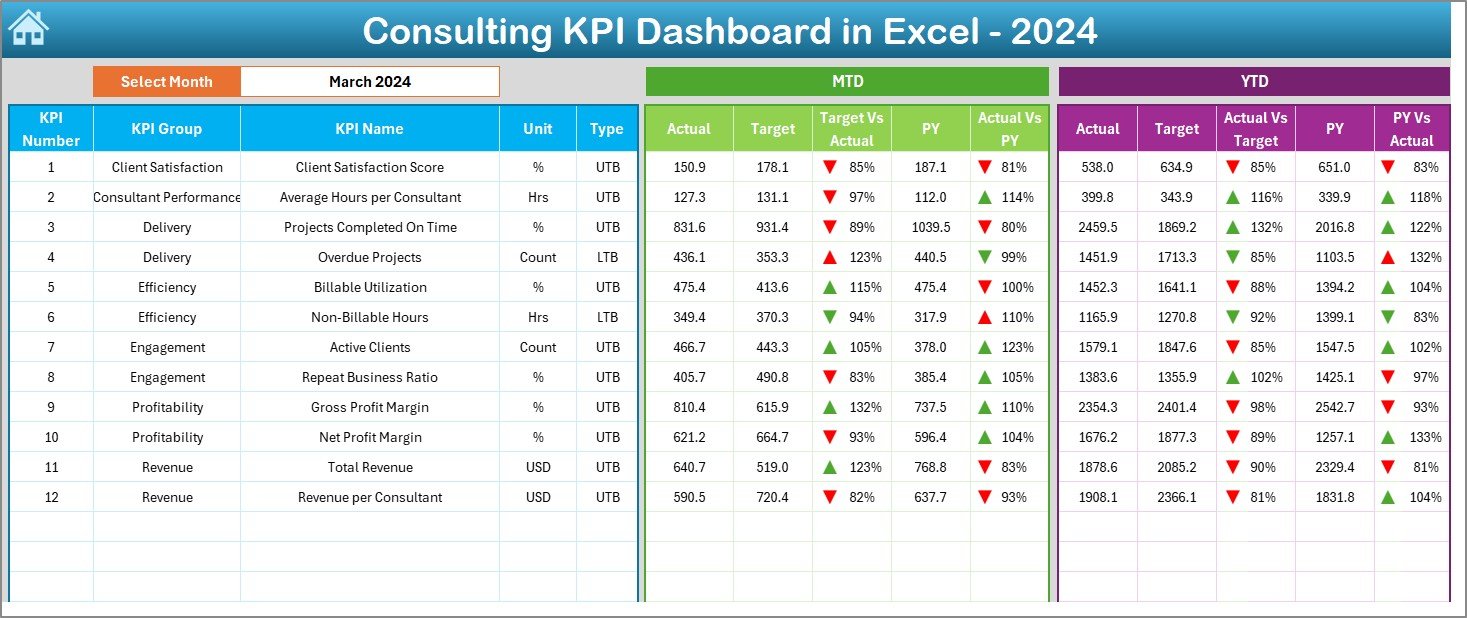
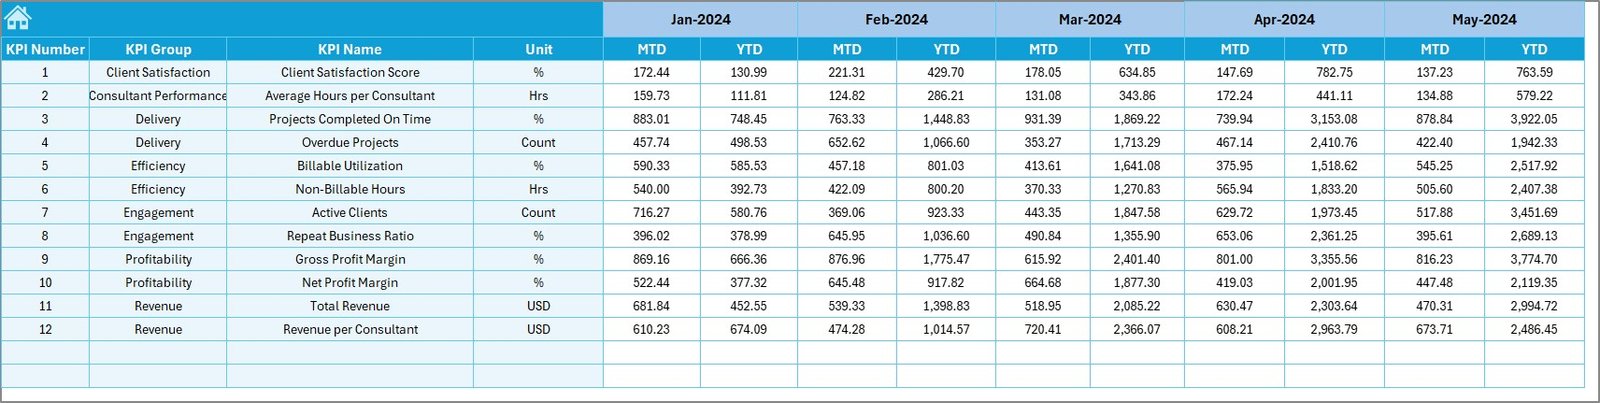
✅ Dynamic KPI Tracking: Monitor MTD (Month-to-Date) and YTD (Year-to-Date) results across multiple consulting dimensions like revenue, utilization, and satisfaction.
✅ Interactive Navigation: A dedicated Home sheet with buttons lets users easily jump between dashboard sections — even beginners can navigate with ease.
✅ Visual Performance Insights: Conditional formatting and traffic-light indicators (green/red arrows) instantly highlight where you’re performing well and where attention is needed.
✅ Target vs Actual Comparison: Quickly compare actual results against set targets and previous year data for deeper business insights.
✅ Fully Customizable: Add new KPIs, modify formulas, or change visuals to suit your consulting firm’s goals.
✅ Cost-Effective & No Coding: Built entirely in Excel — no Power BI or complex software required!
✅ Client-Ready Reports: Present performance summaries visually during client meetings for greater impact.
This dashboard turns your raw numbers into powerful visuals that help you make informed, strategic business decisions.
📊 What’s Inside the Consulting KPI Dashboard in Excel
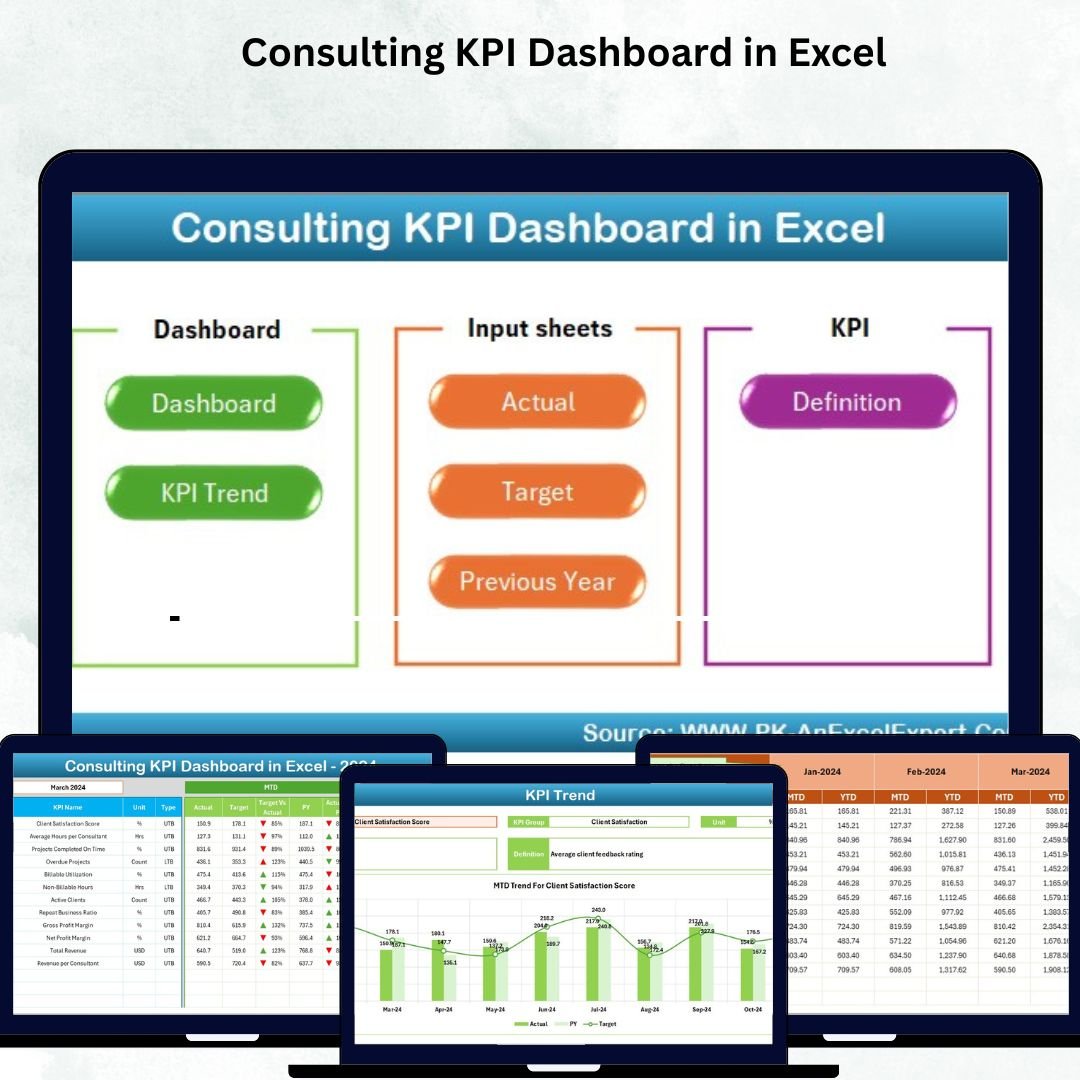
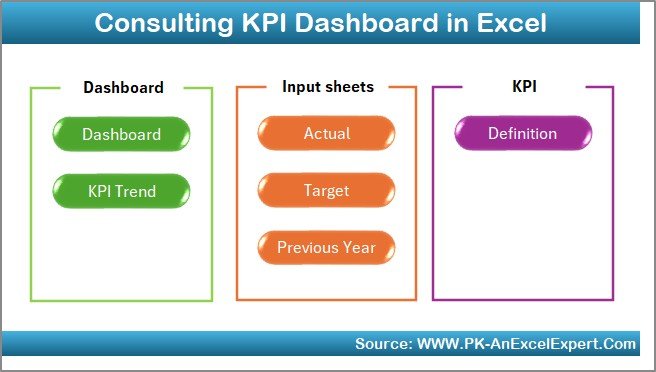
The Consulting KPI Dashboard in Excel includes 7 structured worksheet tabs, each designed to serve a specific purpose:
1️⃣ Home Sheet: Acts as the main control center, giving you one-click access to different pages of the dashboard.
2️⃣ Dashboard Sheet: Displays interactive visuals and summary cards for KPIs such as Project Completion %, Client Satisfaction, and Revenue vs Target.
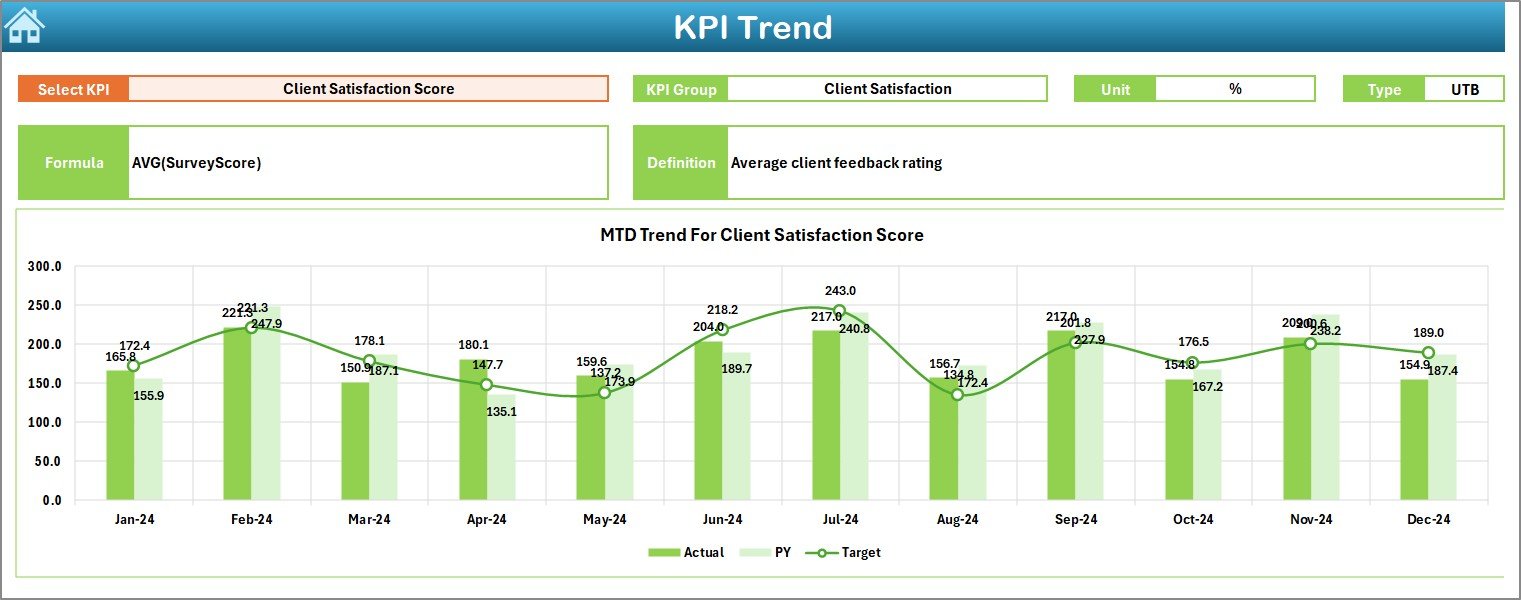
3️⃣ KPI Trend Sheet: Choose any KPI from a dropdown list to view performance trends, formulas, and definitions over time.
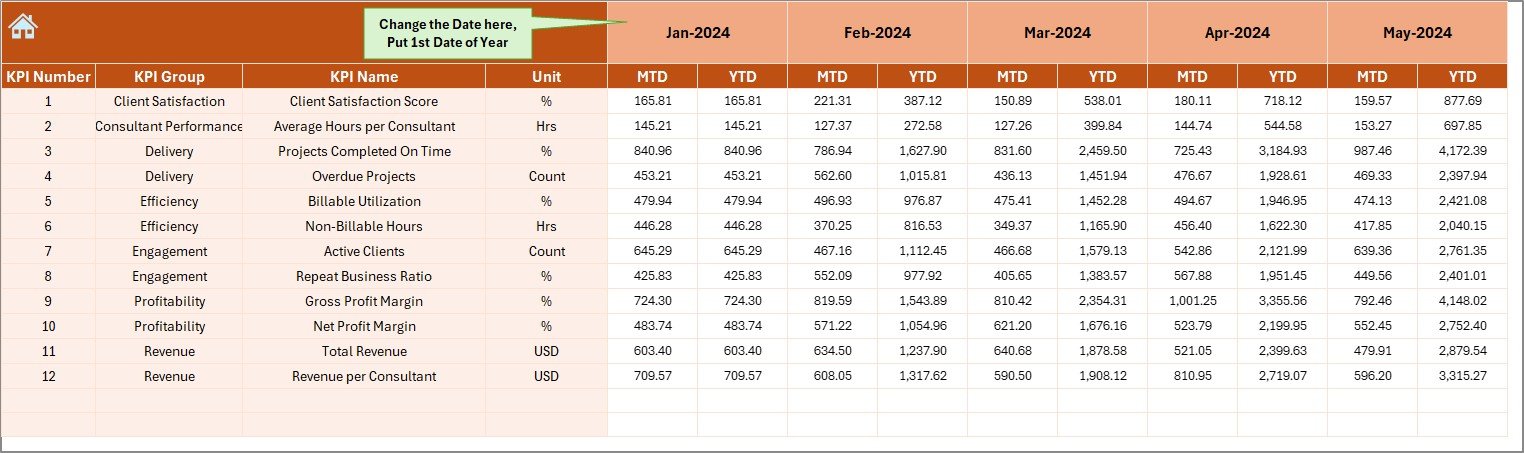
4️⃣ Actual Numbers Input Sheet: Enter real-time performance data for MTD and YTD values. The dashboard auto-updates instantly.
5️⃣ Target Sheet: Define monthly and yearly KPI targets for clear performance goals.
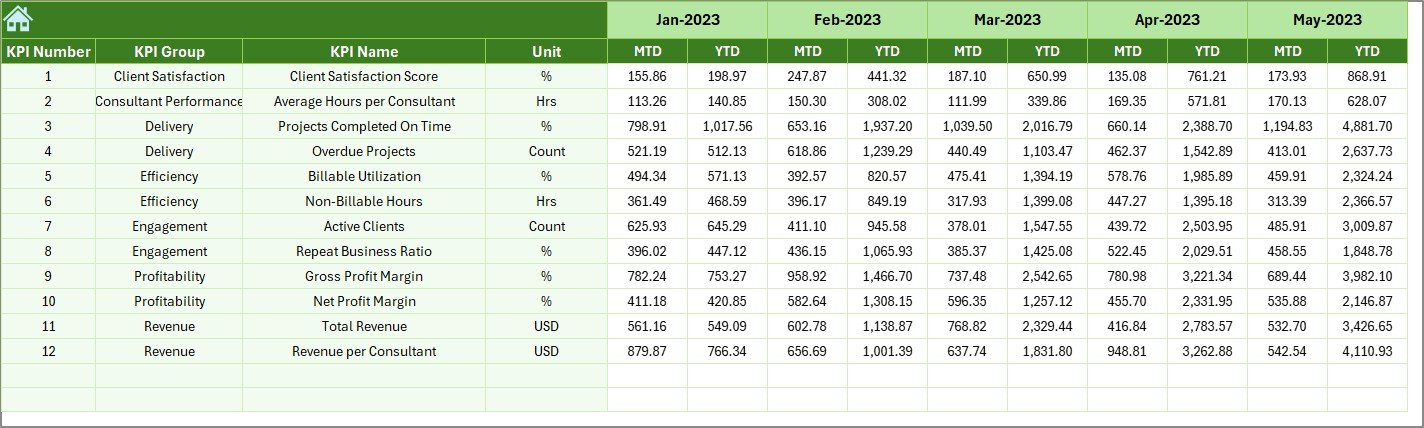
6️⃣ Previous Year Sheet: Compare this year’s results with past data to track growth and improvements.
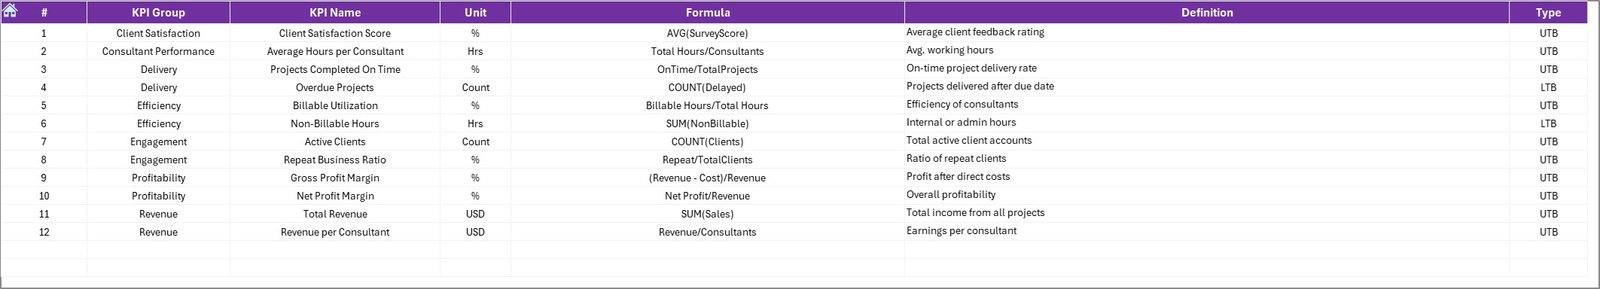
7️⃣ KPI Definition Sheet: A reference guide listing KPI Name, Group, Unit, Formula, and Definition — ensuring consistency across the organization.
Each sheet works together to give consulting managers and analysts a holistic view of firm performance.
⚙️ How to Use the Consulting KPI Dashboard in Excel
🚀 Step 1: Open the Excel file and start from the Home sheet to navigate easily.
📅 Step 2: Select the desired month (cell D3) to view MTD and YTD results dynamically.
📈 Step 3: Input actual data in the Actual Numbers Input sheet and update targets in the Target Sheet.
📊 Step 4: Check performance on the Dashboard Sheet and compare with the previous year for better insights.
📋 Step 5: Review trends using the KPI Trend Sheet to identify strengths and improvement areas.
That’s it — no macros or coding needed. The dashboard updates automatically, offering instant visual insights every month!
👩💼 Who Can Benefit from This Consulting KPI Dashboard
🎯 Consulting Firms: From boutique agencies to global consultancies, streamline your KPI reporting in one place.
📊 Project Managers: Track project progress, utilization, and client satisfaction without juggling multiple files.
💼 Finance and Operations Teams: Evaluate revenue, billing, and profit margins effectively.
📈 Consultants & Analysts: Measure productivity and identify patterns that influence performance outcomes.
🏢 Corporate Strategy Teams: Align operational performance with overall business objectives for smarter decisions.
No matter your role, this Excel-based KPI dashboard simplifies performance tracking and promotes transparency across the organization.
🧠 Why Choose This Dashboard?
✅ Saves hours of manual reporting
✅ Encourages data-driven culture
✅ Improves client communication with clear visuals
✅ Requires zero technical skills — just Excel
✅ Ideal for monthly performance reviews and presentations
If you’re ready to make consulting performance tracking simple, efficient, and impactful — this dashboard is your next smart investment.


Reviews
There are no reviews yet.