


The Comparative Analysis Dashboard in Power BI is a robust and interactive tool designed to provide a deep dive into sales performance, budget adherence, and year-over-year growth trends. Whether you’re an analyst, sales manager, or business executive, this dashboard offers valuable insights into actual vs. budgeted sales, past year comparisons, and future projections.

Key Features
✅ Dynamic Year Selector:
The dashboard includes an interactive year slicer, allowing users to filter and compare sales data across different time periods. This makes it easier to analyze yearly trends and pinpoint variations in performance.
✅ Insightful Visuals for Performance Tracking:
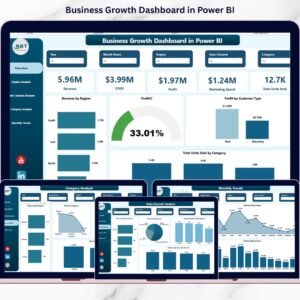
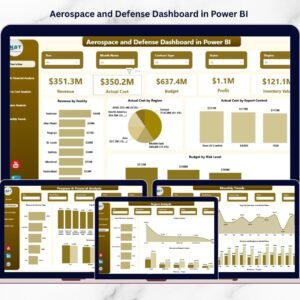
- The dashboard prominently displays Current Year (CY) Sales, Previous Year (PY) Sales, Budgeted Sales, and Variance Percentages.
- Doughnut Charts categorize sales distribution across different product categories, helping stakeholders understand which segments contribute most to revenue.
- Scatter Plots highlight the sales growth percentage vs. total sales by product name, allowing businesses to identify high and low-performing products.
✅ Trend and Forecast Analysis:
- A monthly trend line tracks CY Sales, PY Sales, and Budgeted Sales, visually demonstrating seasonal trends and performance fluctuations over the year.
- The Sales Trend with Forecast Chart leverages predictive analytics to estimate future sales, helping businesses make data-driven decisions.
✅ Budget Variance Analysis:
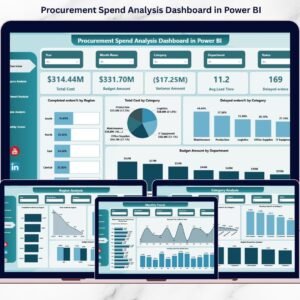
- This section provides a budget variance percentage by category and month, showing how actual sales compare to projected figures.
- A waterfall chart highlights monthly deviations, identifying where budgets were exceeded or fell short.
✅ Product-Level Sales Comparison:
- Bar charts display CY Sales, PY Sales, and Budgeted Sales for individual products, making it easy to track performance at a granular level.
- This enables businesses to identify which products are exceeding expectations and which require strategic interventions.
Why Use This Dashboard?
📈 Optimize Sales Performance – Gain real-time insights into key sales metrics and identify growth opportunities.
🔍 Make Data-Driven Decisions – Analyze trends, set realistic targets, and align sales strategies with business goals.
📊 Streamline Budgeting & Forecasting – Improve financial planning with budget variance tracking and predictive analytics.
🚀 User-Friendly & Interactive – With Power BI’s slicers, filters, and drill-through features, users can explore data effortlessly.
This Comparative Analysis Dashboard in Power BI is the ultimate tool for organizations looking to enhance performance monitoring, streamline budgeting processes, and drive business success!
Click here to read the detailed blog post Comparative Analysis Dashboard in Power BI
Watch the step-by-step video tutorial: Comparative Analysis Dashboard in Power BI
Also check our Inventory Management Form in Excel


Reviews
There are no reviews yet.