The Comic Books and Publishing Dashboard is growing faster than ever. At the same time, competition is increasing, production costs are rising, and reader preferences are constantly changing. While creativity remains the foundation of success, publishers today must rely on data to stay profitable and competitive. However, when revenue, cost, and production data are scattered across Excel files and manual reports, teams lose clarity instead of gaining insight.
That is exactly where the Comic Books and Publishing Dashboard in Power BI becomes a powerful solution 📚📊.
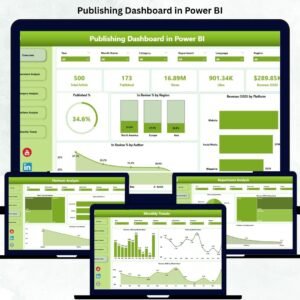
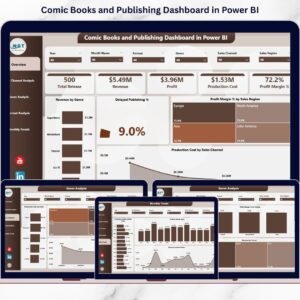
This ready-to-use Power BI dashboard transforms raw publishing data into interactive, visual, and actionable insights. It helps comic publishers, studios, and independent creators track revenue, control production costs, monitor profit margins, and identify publishing delays in real time. Instead of reacting late, teams can take proactive, data-driven decisions with confidence.
🔑 Key Features of Comic Books and Publishing Dashboard in Power BI
📊 Centralized Publishing Analytics
Track revenue, costs, profit margins, and delays across the entire publishing operation in one dashboard.
💰 Revenue & Profitability Tracking
Analyze revenue and profit by genre, format, sales channel, region, and month.
⏱️ Publishing Delay Monitoring
Identify delayed publishing percentages early and fix bottlenecks before they escalate.
🎯 Multi-Dimensional Performance Analysis
Use slicers to filter data by genre, format, sales channel, or time period instantly.
📈 Interactive Power BI Visuals
KPI cards, charts, and slicers provide clear insights without manual calculations.
🔄 Easy Data Refresh & Scalability
Connects seamlessly with Excel and other data sources, making updates quick and reliable.
📦 What’s Inside the Comic Books and Publishing Dashboard in Power BI
This dashboard includes five powerful analytical pages, each designed to answer key business questions.
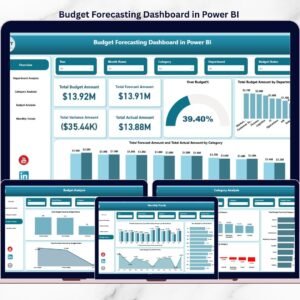
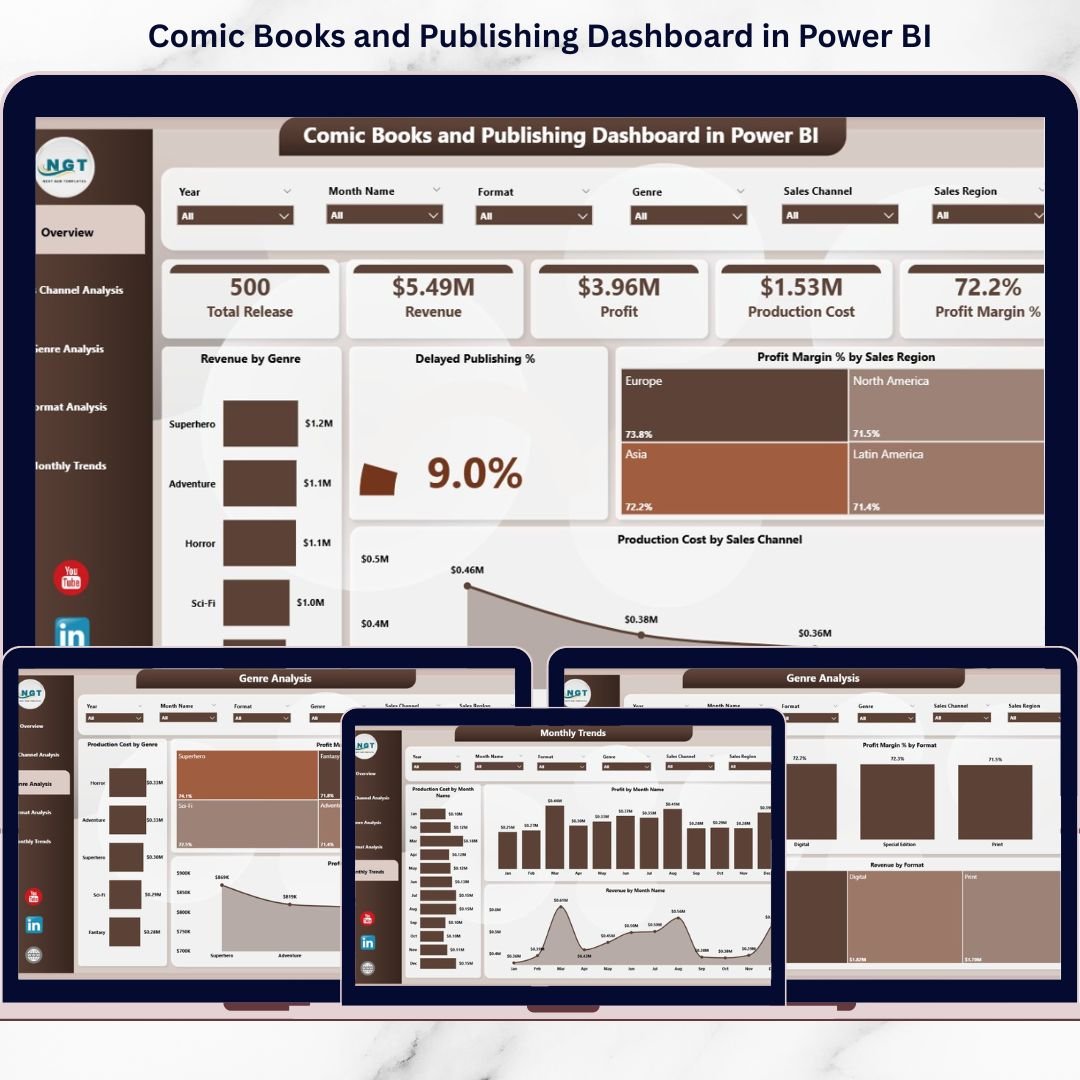
📌 Overview Page
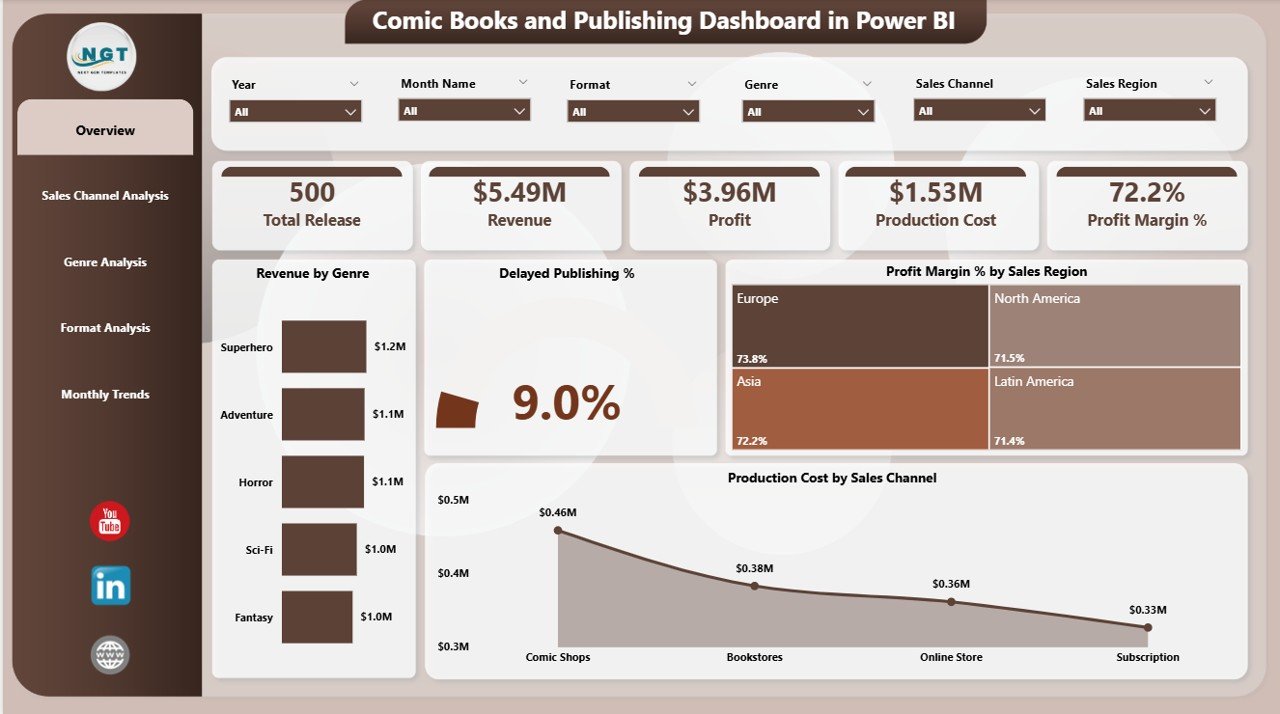
The main landing page that delivers a high-level snapshot of overall publishing performance.
-
Revenue by Genre
-
Delayed Publishing %
-
Profit Margin % by Sales Region
-
Production Cost by Sales Channel
-
KPI cards for instant visibility
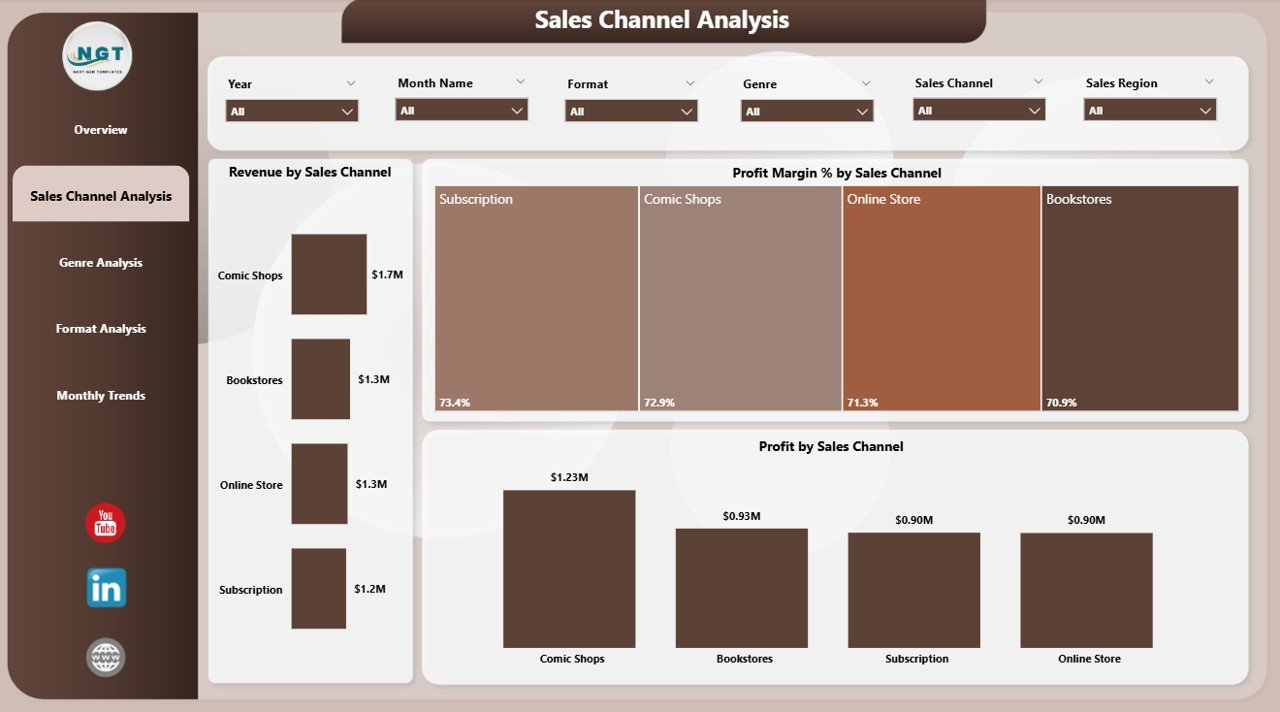
📢 Sales Channel Analysis Page
Focuses on how different channels contribute to revenue and profit.
-
Revenue by Sales Channel
-
Profit by Sales Channel
-
Profit Margin % by Sales Channel
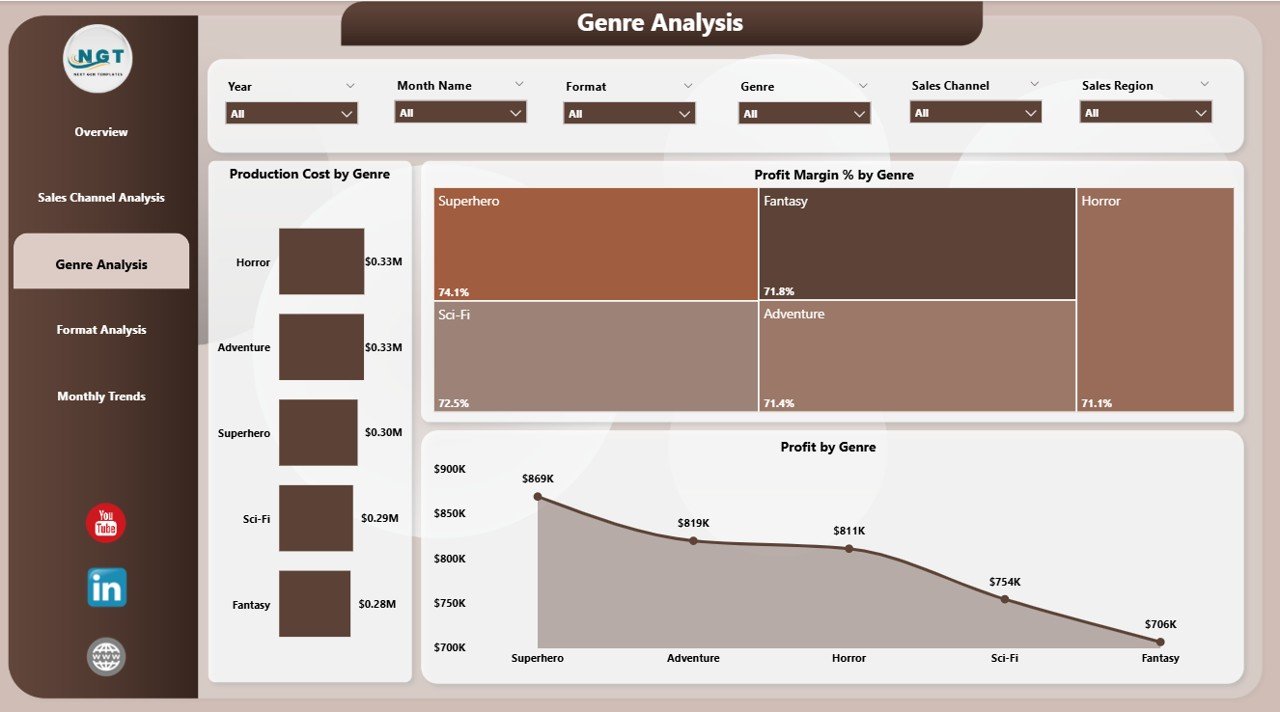
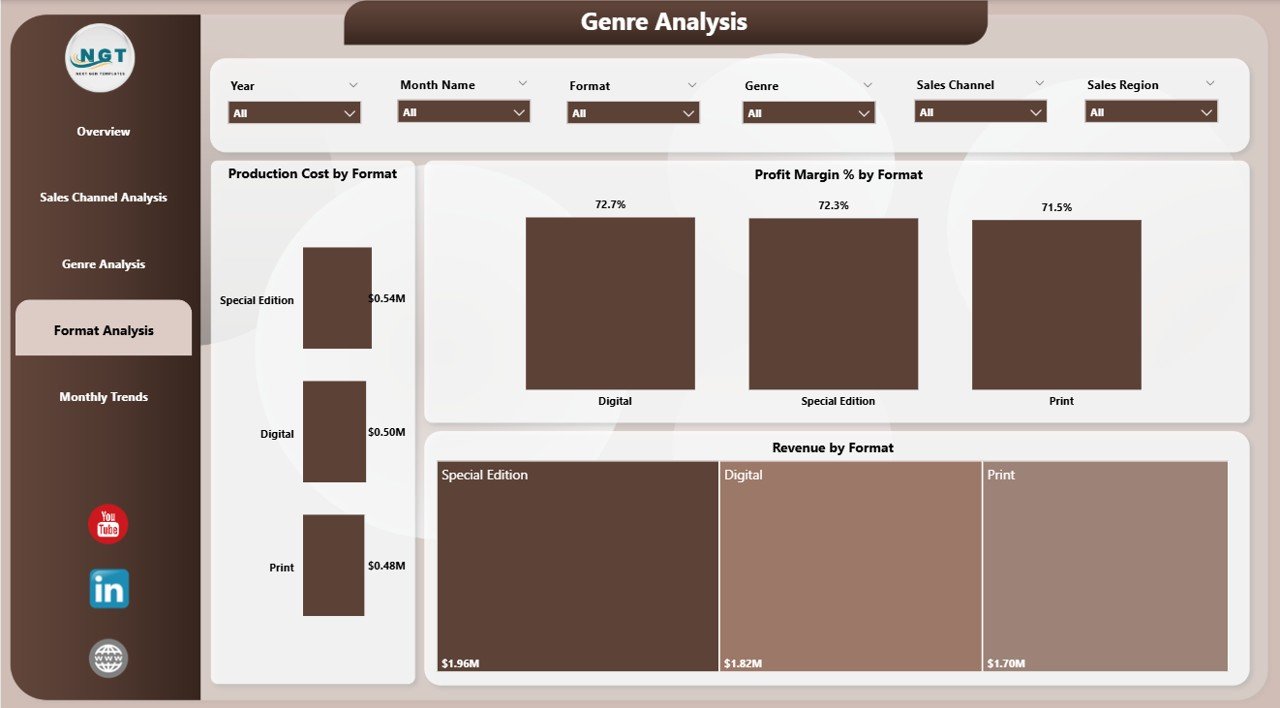
🎭 Genre Analysis Page
Helps publishers understand which comic genres drive profitability.
-
Production Cost by Genre
-
Profit by Genre
-
Profit Margin % by Genre
📦 Format Analysis Page
Evaluates performance across publishing formats.
-
Revenue by Format
-
Production Cost by Format
-
Profit Margin % by Format
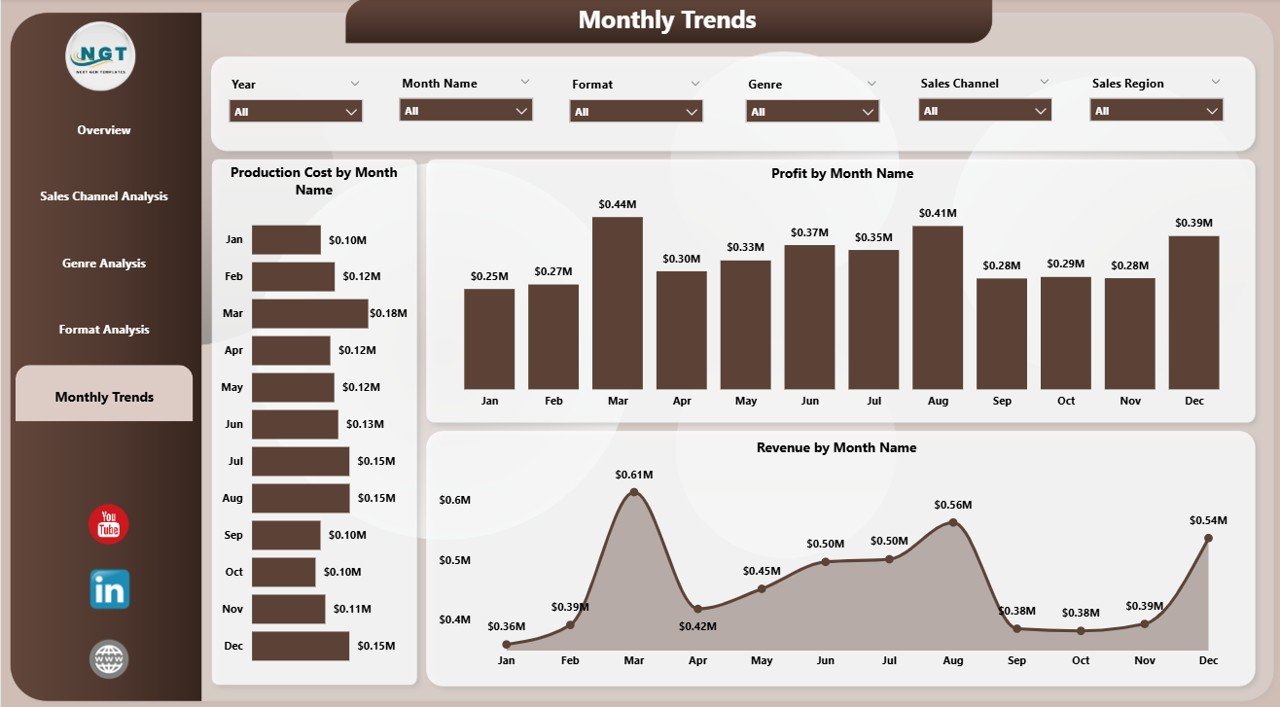
📅 Month Analysis Page
Tracks trends and seasonality over time.
-
Revenue by Month
-
Production Cost by Month
-
Profit Margin % by Month
Together, these pages give publishers complete visibility into financial and operational performance.
🛠️ How to Use the Comic Books and Publishing Dashboard in Power BI
Using the dashboard is simple and intuitive:
1️⃣ Update sales, cost, and publishing data in your Excel or data source
2️⃣ Refresh the Power BI dashboard
3️⃣ Use slicers to filter by genre, format, sales channel, or month
4️⃣ Review KPIs, charts, and trends
5️⃣ Identify high-performing areas and problem zones
6️⃣ Make faster, data-driven publishing decisions
Within minutes, complex publishing data becomes clear and actionable.
👥 Who Can Benefit from This Comic Books and Publishing Dashboard in Power BI
📚 Comic Publishers & Studio Owners
💼 Finance & Accounting Teams
🧑💼 Production Managers
📈 Sales & Distribution Teams
✍️ Editorial Leadership
🏢 Independent & Mid-Sized Publishing Houses
Whether you manage a growing studio or an established publishing house, this dashboard gives you clarity and control.